Data Interpretation Test Practice – Day 55 | Data Interpretation Questions:
Dear Readers, Important Practice Data Interpretation Questions for IBPS Exams 2017 was given here with Solutions. Aspirants those who are preparing for the Bank Examination and other Competitive Examination can use this material.
[WpProQuiz 735]
Click “Start Quiz” to attend these Questions and view Solutions
Directions (Q1-5) study the following information carefully and answer the questions given below.
The following bar graph shows time taken to travel (in hours) by six vehicles on two different days and the table shows the distance covered by six vehicles on two days.
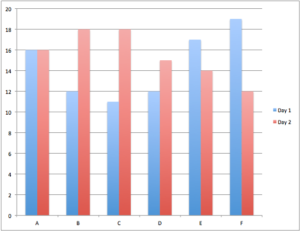
| Vehicle | Day 1 | Day 2 |
| A | 832 | 864 |
| B | 516 | 774 |
| C | 693 | 810 |
| D | 552 | 765 |
| E | 935 | 546 |
| F | 703 | 636 |
1). Which of the following vehicles travelled at the same speed on both the days?
- A
- C
- F
- B
- None of these
2). What was the difference between the speed of vehicle A on day 1 and the speed of vehicle C on the same day?
- 7 km/h
- 12 km/h
- 11 km/h
- 8 km/h
- None of these
3). What was the speed of vehicle C on day 2 in terms of meters per second?
- 15.3
- 12.8
- 11.5
- 13.8
- None of these
4). The distance travelled by vehicle F on day 2 was approximately what percent of the distance travelled by it on day 1?
- 80
- 65
- 85
- 95
- 90
5). What is the respective ratio of the speed of vehicle D and vehicle E on day 2?
- 15:13
- 17:13
- 13:11
- 17:14
- None of these
Direction (Q6-10) The following graph shows the price of different types of vegetable in various months in Agra and the table shows the ratio of prices of vegetable in Agra and Vrindavan
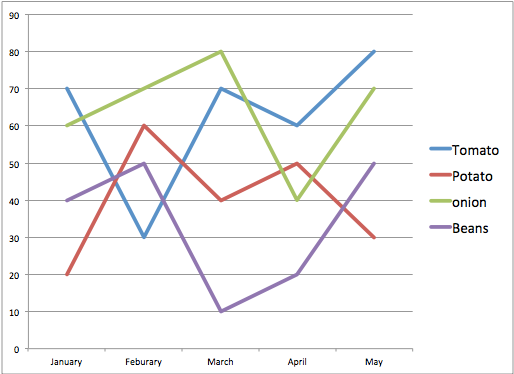
| Agra : Vrindavan | |
| Onion | 3:4 |
| Tomato | 5:2 |
| Potato | 5:6 |
| Beans | 5:4 |
6). In which month the average price of vegetable in Agra is maximum?
- Jan
- Feb
- March
- April
- May
7). The rate of Beans in Agra in May is what percent to rate of onion in April in Vrindavan?
- 93.75%
- 84.75%
- 73.65%
- 62.55%
- 51.45%
8). What is the percentage increase in the price of Potato in Agra from Jan to May?
- 48%
- 43%
- 75%
- 50%
- 60%
9). What is the ratio of the rate of tomato in Agra in jan to the rate of potato in Vrindavan in Feb?
- 34:31
- 32:37
- 35:36
- 31:36
- 29:25
10). Which vegetable has the maximum average price during five months in Agra?
- tomato
- Onion
- Potato
- Bean
- Cant be determined.
Click Here for More Practice Data Interpretation Questions