Data Interpretation Test Practice – Day 46 | Data Interpretation Questions:
Dear Readers, Important Practice Data Interpretation Questions for IBPS Exams 2017 was given here with Solutions. Aspirants those who are preparing for the Bank Examination and other Competitive Examination can use this material.
Click Here for More Practice Data Interpretation Questions
[WpProQuiz 629]Directions (Q. 1-5): The following graph shows the percentage growth of six company mobile users from 2015 to 2016 and 2016 to 2017.
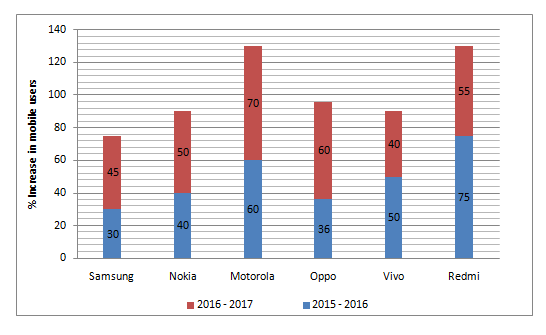
- If the number of users of Motorola in year 2017 and that of Oppo in year 2015 are equal and they are 27.2 lakh each the number of users of Motorola in year 2016 is what percentage of number of users of Oppo in the same year?
- 50%
- 37.5%
- 70%
- 65%
- 45%
- The number of users of Vivo in year 2016 was what fraction of its number of users in 2017?
- 21:10
- 10:17
- 9: 23
- 10:21
- 17:21
- In year 2016 the number of users of Samsung and Nokia are equal and the number of users of Samsung in year 2017 is 37.7 lakh. What is the number of users of Nokia in year 2017?
- 45 lakh
- 42 lakh
- 46 lakh
- 40 lakh
- 39 lakh
- If the number of users of Redmi in year 2016 was 12 lakh, what will be its number of users in year 2017?
- 30.65 lakh
- 34.25 lakh
- 33.45 lakh
- 35.65 lakh
- 32.55 lakh
- The number of users of Oppo in year 2015 was what per cent of its number of users in year 2017?
- 42.5 %
- 57.5 %
- 62.5 %
- 75 %
- 82.5 %
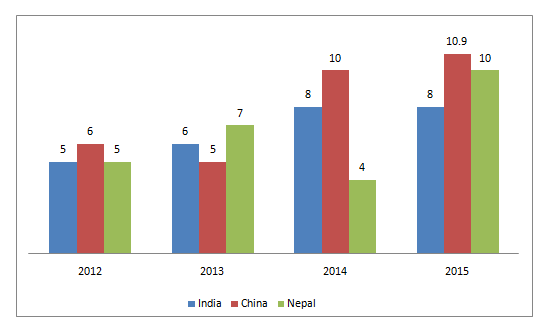
Directions (Q. 6-10): Study the following line graph and the table and answer the questions given below:
Percentage of population below poverty line in different countries of India from 2011 to 2016
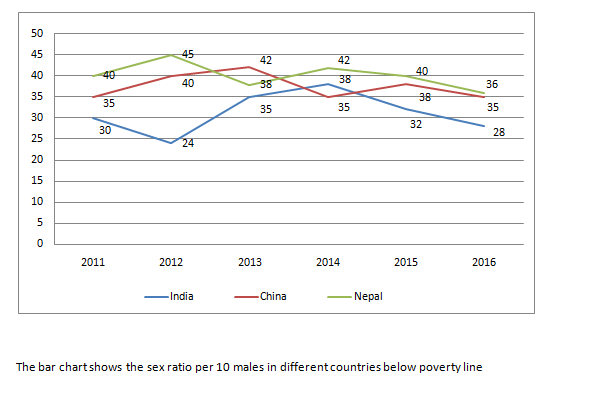
- If there is an increase of 10% in the population of
- India in the year 2013, then how many females are there who are below poverty line in that country in the year 2012, if the population in 2013 was 55 lakh in that country?
- 5 lakh
- 3 lakh
- 1 lakh
- 4 lakh
- None of these
- What is the percentage of the population below poverty line in the year 2013 in China with respect to that in all the years from 2011 to 2016?
- 18.66%
- 20.33%
- 40.66%
- 30.66%
- Cannot be determined
- If the population of China and Nepal in the year 2015 was 55 lakh and 62 lakh respectively then what will be the ratio of the females below poverty line in China to that of the females below poverty line in Nepal in the year 2015?
- 124:109
- 82:97
- 109:124
- 97:123
- None of these
- If in the year 2015 the population of India, China and Nepal was 60 lakh, 55 lakh and 62 lakh respectively, then what is the total population below poverty line in the year 2015 in all three countries?
- 75.60 lakh
- 64.90 lakh
- 74.90 lakh
- 66.50 lakh
- None of these
- The population of Nepal in the year 2012 is 40 lakh. If there is an annual growth of 10% in the population of Nepal from year 2012 to 2014 then what is the percentage increase or decrease in the number of males below poverty line in the year 2014 with respect to that in the year 2012?
- 21% increase
- 15% increase
- 14% increase
- 18% decrease
- None of these
Click Here for More Practice Data Interpretation Questions
[WpProQuiz 629]