Data Interpretation Test Practice – Day 49 | Data Interpretation Questions:
Dear Readers, Important Practice Data Interpretation Questions for IBPS Exams 2017 was given here with Solutions. Aspirants those who are preparing for the Bank Examination and other Competitive Examination can use this material.
Click Here for More Practice Data Interpretation Questions
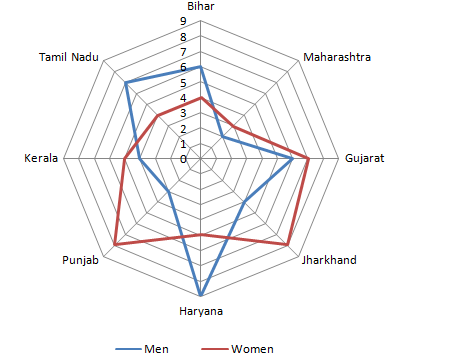
[WpProQuiz 669]Directions (Q. 1-5): Study the following bar charts carefully and answer the following questions. The Pie chart shows the percentage distribution of total population among different countries in world and another bar graph shows the ratio of men to women among them.
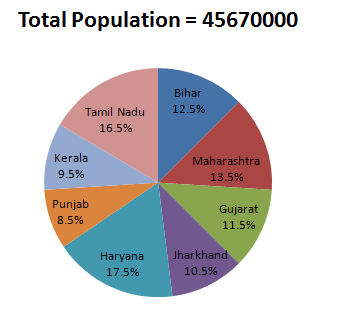
- What is the total number of women population in Punjab, Kerala and Tamil Nadu?
- 7954786
- 7973107
- 7963589
- 7383484
- 7973797
- What is the total number of men population in Jharkhand, Haryana and Kerala? (Approximately)
- 8692314
- 8678514
- 8664614
- 8657414
- 8602714
- The number of men population in Jharkhand, Haryana and Punjab is what percent of total number of population in the all countries together?
- 19
- 17
- 21
- 23
- 28
- What is the total population from Bihar, Maharashtra and Haryana?
- 19866450
- 19855140
- 19722780
- 19478520
- 19945890
- What is the ratio of men population in Haryana to women population in Kerala? (Approximately)
- 83 : 43
- 81: 47
- 38 : 81
- 563 : 266
- None of these
Directions (Q. 6-10): Following Line graph shows the number of cars produced (in thousands) and the radar graph shows the percentage of produced cars sold by two companies Toyota and Toyota from 2011 to 2016.
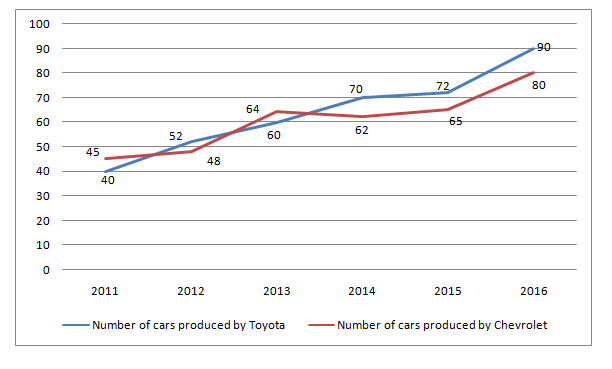
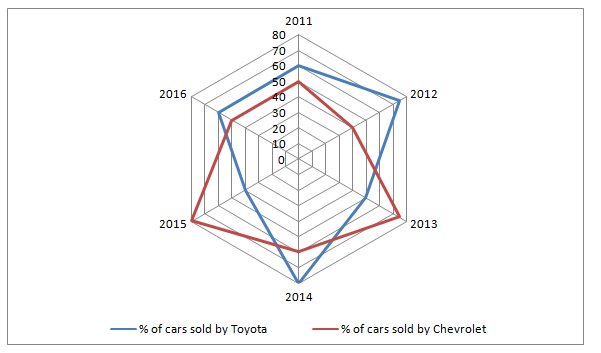
- What is the ratio of the number of cars sold by chevrolet in 2015 to the number of cars that remained unsold by Toyota in the year 2012?
- 3 : 1
- 4 : 1
- 7 : 4
- 5 : 2
- 4 : 3
- The number of cars sold by Toyota in year 2014 is what percentage more than the number of cars unsold by chevrolet in year 2013?
- 250%
- 150%
- 225%
- 275%
- 175%
- What is the difference between the total number of cars sold and the total number of unsold cars of chevrolet in all six years?
- 52400
- 68100
- 75700
- 79600
- 73800
- What is the total number of cars produced by Toyota which remained unsold in all six years together?
- 145400
- 160400
- 152200
- 132600
- 158500
- The number of cars sold by Toyota in 2012 is what percentage of the number of cars sold by Toyota in the year 2016?
- 94.5%
- 125%
- 82.5%
- 97.5%
- 112.5%
Click Here for More Practice Data Interpretation Questions
[WpProQuiz 669]