Quantitative Aptitude Questions (Data Interpretation) for SBI Clerk / IDBI Executive 2018 Day-42:
Dear Readers, SBI is conducting Online preliminary Examination for the recruitment of Clerical Cadre. preliminary Examination of SBI Clerk was scheduled from June/July 2018. To enrich your preparation here we have providing new series of Data Interpretation – Quantitative Aptitude Questions. Candidates those who are appearing in SBI Clerk Prelims and IDBI Executive Exams can practice these Quantitative Aptitude average questions daily and make your preparation effective.
[WpProQuiz 1559]
Click “Start Quiz” to attend these Questions and view Solutions
Daily Practice Test Schedule | Good Luck
| Topic | Daily Publishing Time |
| Daily News Papers & Editorials | 8.00 AM |
| Current Affairs Quiz | 9.00 AM |
| Logical Reasoning | 10.00 AM |
| Quantitative Aptitude “20-20” | 11.00 AM |
| Vocabulary (Based on The Hindu) | 12.00 PM |
| Static GK Quiz | 1.00 PM |
| English Language “20-20” | 2.00 PM |
| Banking Awareness Quiz | 3.00 PM |
| Reasoning Puzzles & Seating | 4.00 PM |
| Daily Current Affairs Updates | 5.00 PM |
| Data Interpretation / Application Sums (Topic Wise) | 6.00 PM |
| Reasoning Ability “20-20” | 7.00 PM |
| English Language (New Pattern Questions) | 8.00 PM |
| General / Financial Awareness Quiz | 9.00 PM |
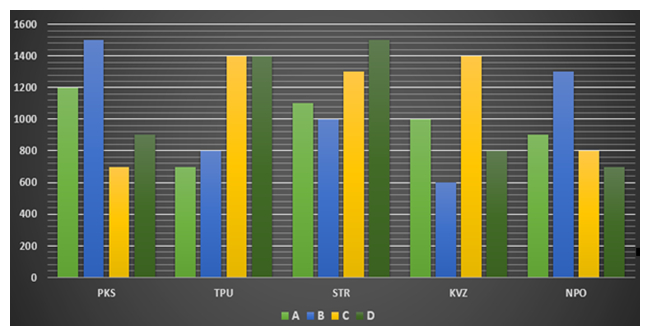
Directions (Q. 1 – 5): Study the following information carefully and answer the questions given below:
The following graph represents number of four different products manufactured by five different companies in 2015.
- Total number of product A manufactured by all the companies in 2015 is what percent more/less than the total number of product D manufactured by all the companies in 2015.
a) 6.85% less
b) 7.54% less
c) 6.85% more
d) 7.54% more
e) none of these
- Number of product B manufactured by STR in 2016 is 30% more than that of 2015 and number of product C manufactured by KVZ in 2016 is 20% less than that of 2015. Find the respective ratio of number of product B manufactured by STR in 2016 and number of product C manufactured by KVZ in 2016.
a) 56:65
b) 45:54
c) 65:56
d) 54:45
e) None of these
- Find the difference between total number of products manufactured by STR in 2015 and total number of products manufactured by NPO in 2015.
a) 1200
b) 1800
c) 2400
d) 2800
e) none of these
- If the production of products A, B, C and D by TPU in 2016 is 20%, 30%, 40% and 50% respectively more than those of 2015, find the sum of production of all the products by TPU in 2016.
a) 5490
b) 4950
c) 5940
d) 4590
e) None of these
- Number of product C manufactured by TPU in 2016 is 25% more than that of 2015 and number of product C manufactured by TPU in 2017 is 10% less than that of 2016. Number of product A manufactured by NPO in 2016 is 10% less than that of 2015 and number of product A manufactured by NPO in 2017 is 30% more than that of 2016. Number of product C manufactured by TPU in 2017 is what percent of number of product A manufactured by NPO in 2017?
a) 108.67%
b) 135.52%
c) 112.45%
d) 149.57%
e) None of these
Direction (Q. 6 – 10) Read the following information carefully and answers the following questions. The table below shows number of pens produced and sold by three different companies and the given years:
| Year | Company M | Company N | Company O | |||
| Production
|
Sales | Production | Sales | Production | Sales | |
| 2006 | 450 | 60% | 20% | 240 | ||
| 2007 | 600 | 43% | 500 | 15% | ||
| 2008 | 20% | 40% | 180 | |||
| 2009 | 480 | 15% | 450 | 40% | ||
| 2010 | 680 | 30% | 600 | |||
- If the total number of pens sold by company M and N in the year 2007 is 400 and the number of pens sold by company N in 2008 is 200 more than pens sold by the same company in 2007 then find the number of pens produced by company N in 2008?
a) 200
b) 400
c) 855
d) 305
e) 350
- If the ratio of the number of pens sold by company M in 2009 to that in 2010 is 8:9 then find the approximate percentage of pens were sold by company M in 2010?
a) 18
b) 12
c) 25
d) 30
e) 35
- If company O produced ‘x’ number of pens in 2007 and ‘x+ 200’ number of pens in 2009 and the total number of pens sold by company O in these years is 630 then find how many pens were sold in 2009?
a) 200
b) 250
c) 480
d) 300
e) 350
- Company N produced 900 pens in 2010 and the number of pens sold by the same company in 2007 is 10 % more than number of pens sold by the company in 2010 then find number of pens produced by the same company in 2008 if the number of pens sold by company N in 2007 and 2008 is in the ratio of 9:8?
a) 200
b) 400
c) 100
d) 660
e) 350
- If the average number of pens sold by company M in 2006, 2007 and 2008 is 200 then find the production of company M in 2008 is what percentage of the production of company N in 2009?
a) 100 %
b) 80 %
c) 75 %
d) 65 %
e) 55 %
Answers:
Directions (Q. 1 – 5):
- Answer: b
Total number of product A manufactured by all the companies in 2015
= 1200 + 700 + 1100 + 1000 + 900
= 4900
Total number of product D manufactured by all the companies in 2015
= 900 + 1400 + 1500 + 800 + 700
= 5300
Required percentage = (5300 – 4900)/5300 x 100
= (400/5300) x 100
= 7.54% less
- Answer: c
Number of product B manufactured by STR in 2016 = 1000 x 130/100 = 1300
Number of product C manufactured by KVZ in 2016 = 1400 x 80/100 = 1120
Required ratio = 1300 : 1120 = 65:56
- Answer: a
Total number of products manufactured by STR in 2015
= 1100 + 1000 + 1300 + 1500
= 4900
Total number of products manufactured by NPO in 2015
= 900 + 1300 + 800 + 700
= 3700
Required difference = 4900 – 3700 = 1200
- Answer: c
Sum of production of all the products by TPU in 2016
= 700 x 120/100 + 800 x 130/100 + 1400 x 140/100 + 1400 x 150/100
= 840 + 1040 + 1960 + 2100
= 5940
- Answer: d
Number of product C manufactured by TPU in 2017
= 1400 x 125/100 x 90/100
= 1575
Number of product A manufactured by NPO in 2017
= 900 x 90/100 x 130/100
= 1053
Required percentage = (1575/1053) x 100 = 149.57%
Direction (Q. 6 – 10)
- Answer (c)
Number of pen sold by company N in 2007
= 400 – (43*600/100)
= 400 – 258
= 142
Number of pen sold company N in 2008= 142+200= 342
Number of pen produced by company N in 2008
= 342*100/40
= 855 pens
- Answer (b)
Number of pens sold by company M in 2009
= 480*15/100= 72
Number of pens sold by company M in 2010
= 72*9/8= 81
Required percentage= 81*100/680= 12%
- Answer (c)
Number of pens sold in 2007
= x*15/100 + (x+200)*40/100= 630
= 15x/100 + 40x/100 + 80= 630
= (15x+ 40x)/100= 630- 80
= 55x= 550*100
= x= 1000 pens
So,
Number of pens sold in 2009
= (1000+200)*40/100
= 480 pens
- Answer (d)
Number of pens sold by company N in 2010
= 900*30/100
= 270 pens
Number of pens sold by company N in 2007
= 270*110/100
= 297 pens
Number of pens sold by company N in 2008
= 297*8/9
= 264 pens
Number of pens produced by company N in 2008
= 264*100/40
= 660 pens
- Answer (b)
Total pens produced = 200*3= 600
Number of pens sold M in 2008
= 600- 60% of 450 – 43% of 600
= 600 – 270 – 258
= 72
Pens produced in 2008
= 72*100/20
= 360
Required percentage
= 360*100/450
= 80%
Click Here for More Quantitative Aptitude Questions