Data Interpretation Test Practice – Day 35 | Data Interpretation Questions:
Dear Readers, Important Practice Data Interpretation Questions for IBPS Exams 2017 was given here with Solutions. Aspirants those who are preparing for the Bank Examination and other Competitive Examination can use this material.
Click Here for More Practice Data Interpretation Questions
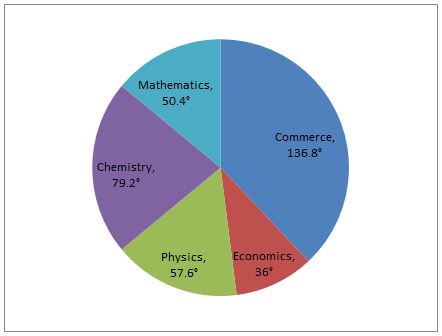
[WpProQuiz 531]Directions (Q. 1-5): Study the following pie chart carefully to answer the questions.
Degree Wise Break-up of Students Studying in Various Departments of a College and the ratio of Men to Women
Total number of students = 3250
Respective Ratio of Men to Women in each Department
| Department | Men | Women |
| Commerce | 4 | 1 |
| Economics | 12 | 13 |
| Physics | 7 | 3 |
| Chemistry | 3 | 2 |
| Mathematics | 6 | 7 |
- What is the total number of men studying in the College?
- 2147
- 2397
- 2257
- 2667
- 2917
2) The number of men studying in the Commerce department of the college forms what per cent of the total number of students studying in that department?
- 73%
- 85%
- 77%
- 80%
- 65%
3) What is the respective ratio of the number of women studying in the Economics department to the number of men studying in the Physics department?
- 13:17
- 15:23
- 13:28
- 14:33
- 28:13
4) What is the number of men studying in the Chemistry department?
- 415
- 427
- 430
- 435
- 429
5) The number of women studying in the Physics department of the College forms what per cent of the total number of students in the College from all departments together?
- 1.6%
- 4.8%
- 6.4%
- 3.9%
- 2.4%
Direction (Q. 6-10): Study the following table carefully answer the questions given below:
Number of shirts of different prices bought over the years.
| Price | Years | |||||
| 2011 | 2012 | 2013 | 2014 | 2015 | 2016 | |
| More than 5,000 | 50 | 106 | 2 | 30 | 25 | 75 |
| 4,000 – 5,000 | 105 | 1000 | 40 | 105 | 400 | 375 |
| 3,000 – 3,999 | 70 | 100 | 80 | 115 | 200 | 240 |
| 2,000 – 2,999 | 300 | 500 | 100 | 216 | 135 | 300 |
| 1,000 – 1,999 | 140 | 370 | 200 | 225 | 175 | 470 |
| 500 – 999 | 200 | 700 | 15 | 400 | 75 | 530 |
| Less than 500 | 65 | 135 | 111 | 188 | 25 | 65 |
- In the price range of 1000 – 1999 the number of shirts bought in 2011 and 2016 together is what percent of the number of shirts bought in 2013 and 2015 in the 2000 – 2999 price range?
- 225.95
- 259.57
- 280.65
- 245.78
- 266.52
- What is the ratio between the number of shirts in price range 4000 – 5000 bought in 2011 and 2015 together and number of shirts in price range 1000 – 1999 bought in 2012 and 2016 together?
- 168 : 101
- 103 : 174
- 91 : 159
- 101 : 168
- None of these
- What is the difference between the number of shirts bought in 2015 and 2016?
- 950
- 1080
- 1020
- 1210
- 1460
- In which year maximum number of shirts was bought?
- 2012
- 2016
- 2014
- 2015
- None of these
- In which price range maximum shirts were bought in the given years taken together?
- 500 – 999
- 2000 – 2999
- 1000 – 1999
- 3000 – 3999
- None of these
Click Here for More Practice Data Interpretation Questions
[WpProQuiz 531]