Data Interpretation Test Practice – Day 52 | Data Interpretation Questions:
Dear Readers, Important Practice Data Interpretation Questions for IBPS Exams 2017 was given here with Solutions. Aspirants those who are preparing for the Bank Examination and other Competitive Examination can use this material.
Click Here for More Practice Data Interpretation Questions
[WpProQuiz 710]
Click “Start Quiz” to attend these Questions and view Solutions
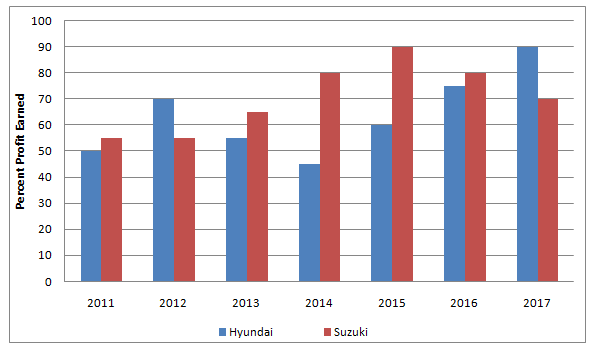
Direction (Q. 1-5): Study the following graph carefully to answer these questions.
Per cent profit earned by two companies producing cars over the years
% Profit = Profit Earned/ Total Investment × 100
Profit Earned = Total Income – Total Investment in the year
- If the amount invested by Suzuki in 2011 is 12 lakh and the income of 2011 is equal to the investment in 2012, what is the amount of profit earned in 2012 by Suzuki?
- 11.13 lakh
- 12.60 lakh
- 10.76 lakh
- 10.23 lakh
- 10.93 lakh
- If the investments of Hyundai in 2014 and 2015 were equal, what is the difference between the profits earned in the two years if the income in 2015 was 24 lakh?
- 2.75 lakh
- 1.65 lakh
- 1.25 lakh
- 2.50 lakh
- 2.25 lakh
- If the income of Hyundai in 2014 and that in 2015 were equal and the amount invested in 2014 was 12 lakh, what was the amount invested in 2015?
- 1087500
- 1065700
- 955200
- 1123800
- 1057600
- If the amount invested by the two companies in 2012 was equal, what was the ratio of the total income of the Hyundai to that of Suzuki in 2012?
- 31 : 34
- 35 : 33
- 34 : 31
- 30 : 17
- 34 : 21
- If the total amount invested by the two companies in 2016 was 27 lakh, while the amount invested by Suzuki was 50% of the amount invested by Hyundai, what was the total profit earned by the two companies together?
- 21.70 lakh
- 20.70 lakh
- 19.80 lakh
- 22.30 lakh
- 18.20 lakh
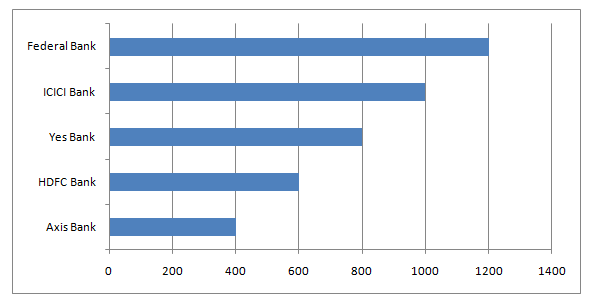
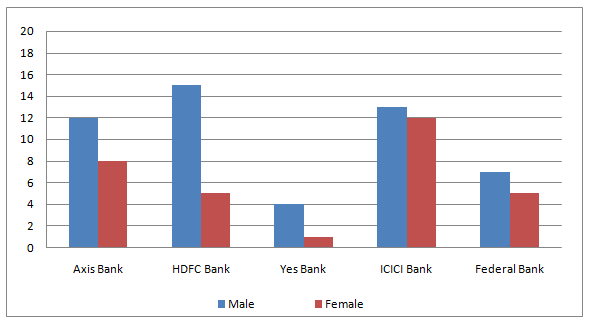
Direction (Q. 6-10): In the following bar graph, the number of employees working in five companies and another bar graph shows the ratio of male and female employees working in hat companies.
- The total number of male employees working in Yes Bank and Federal Bank together is
- 1680
- 1120
- 1550
- 1480
- 1340
- The number of female employees in HDFC Bank and Federal Bank together is
- 700
- 800
- 750
- 650
- 900
- What is the respective ratio between the number of females in Federal Bank and number of females in Axis Bank?
- 8 : 25
- 25 : 8
- 20 : 7
- 23 : 4
- 26 : 9
- The number of female employees working in ICICI Bank is what percent of male employees working in HDFC Bank?
- 87.50
- 107.25
- 106.67
- 97.50
- None of these
- What is the difference between the number of males and females in all companies together?
- 1100
- 1250
- 1550
- 1450
- 950
Click Here for More Practice Data Interpretation Questions