


Data Interpretation Test Practice – Day 39 | Data Interpretation Questions:
Dear Readers, Important Practice Data Interpretation Questions for IBPS Exams 2017 was given here with Solutions. Aspirants those who are preparing for the Bank Examination and other Competitive Examination can use this material.
Click Here for More Practice Data Interpretation Questions
[WpProQuiz 576]Directions (Q. 1-5): Following bar-graph shows the percentage growth of population of six countries in three years.
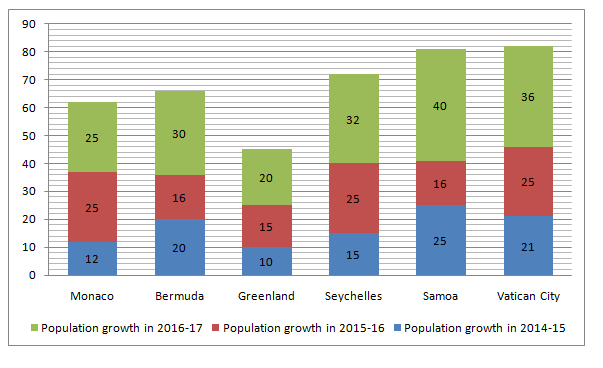
- If the population of Seychelles is 2087250 in the year 2017, what was its population in the year 2014?
- 11 lakh
- 10.5 lakh
- 13.6 lakh
- 12.8 lakh
- 14.2 lakh
- If the population of Samoa and Vatican City in the year 2014 was 12.5 lakh and 10 lakh respectively, what is the difference between the population of Samoa and the population of Vatican City in the year 2017?
- 4.915 lakh
- 4.805 lakh
- 4.385 lakh
- 4.275 lakh
- None of these
- If the population of Greenland was 8.5 lakh in the year 2014, what is the population of Greenland in the year 2017?
- 10.786 lakh
- 13.634 lakh
- 12.903 lakh
- 15.406 lakh
- 12.107 lakh
- If, in the year 2017, the populations of Monaco and Bermuda are 1388800 and 1302912 respectively, the population of Bermuda in the year 2014 was what percentage of the population of Monaco in the year 2014?
- 84%
- 88%
- 95%
- 91%
- 93%
- If the population of Greenland and that of Seychelles were equal in the year 2014, what is the ratio of the population of Greenland to that of Seychelles in 2016?
- 25 : 22
- 22 : 31
- 23 : 32
- 21 : 29
- 22 : 25
Directions (Q. 6-10): Study the following graph carefully to answer the given questions.
Number of People taking Fresh Loans from Different Banks over the Year and the Percentage of Defaulters Amongst them each Year
| Year | Banks | ||||
| Indian Overseas Bank | IDBI Bank | Dena Bank | UCO Bank | Central Bank of India | |
| 2011 | 28246 | 25467 | 27361 | 26345 | 30164 |
| 2012 | 29435 | 32461 | 32081 | 27456 | 35128 |
| 2013 | 29565 | 32652 | 25361 | 28637 | 32443 |
| 2014 | 28314 | 32561 | 23654 | 29045 | 36152 |
| 2015 | 23764 | 25495 | 36125 | 30467 | 35463 |
| 2016 | 24356 | 27649 | 35465 | 31963 | 33214 |
| 2017 | 26553 | 28283 | 34135 | 31974 | 31264 |
Approximate Percentage of Defaulters among them
| Year | Banks | ||||
| Indian Overseas Bank | IDBI Bank | Dena Bank | UCO Bank | Central Bank of India | |
| 2011 | 13% | 15% | 12% | 9% | 19% |
| 2012 | 20% | 17% | 24% | 8% | 23% |
| 2013 | 21% | 16% | 22% | 13% | 25% |
| 2014 | 22% | 18% | 18% | 11% | 19% |
| 2015 | 23% | 13% | 12% | 10%% | 18% |
| 2016 | 22% | 11% | 11% | 20 | 21% |
| 2017 | 21% | 12% | 9% | 21% | 23% |
- Approximately what was the difference between the number of defaulters of UCO Bank in the year 2011 and 2012?
- 175
- 180
- 170
- 185
- 165
- Approximately what was the total number of defaulters of central Bank india in the years 2014 and 2015 together?
- 11250
- 13580
- 13250
- 14250
- 15960
- In which of the following years was the number of defaulters of IDBI Bank, the maximum among the given years?
- 2012
- 2013
- 2014
- 2017
- None of these
- Approximately how many people taking a loan from Indian Overseas Bank in the year 2013 were defaulters?
- 6560
- 6210
- 4760
- 6210
- 6020
- In which of the following years was the difference in number of people taking loan from Dena Bank from the previous year the highest?
- 2015
- 2013
- 2014
- 2012
- None of these
Click Here for More Practice Data Interpretation Questions
[WpProQuiz 576]

