


Data Interpretation Test Practice – Day 58 | Data Interpretation Questions:
Dear Readers, Important Practice Data Interpretation Questions for IBPS Exams 2017 was given here with Solutions. Aspirants those who are preparing for the Bank Examination and other Competitive Examination can use this material.
Click Here for More Practice Data Interpretation Questions
[WpProQuiz 763]
Click “Start Quiz” to attend these Questions and view Solutions
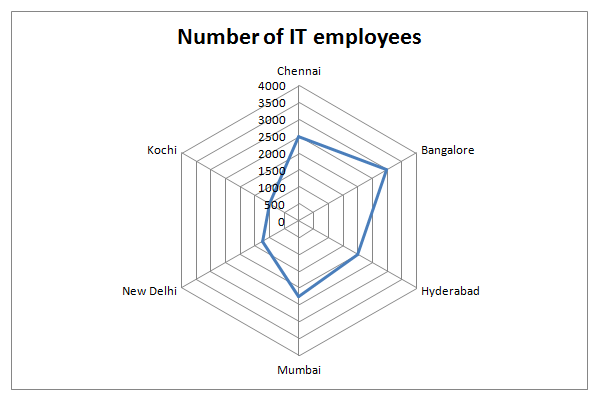
Direction (Q. 1-5): Study the graphs carefully to answer the questions that follow:
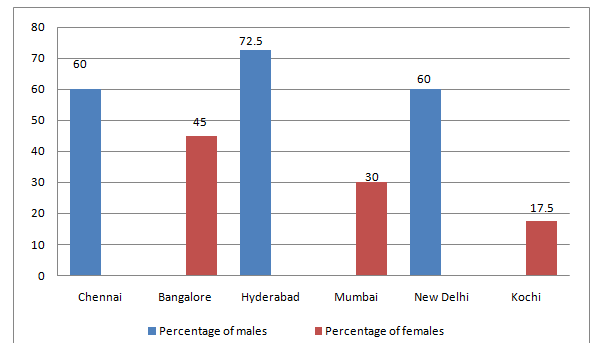
Total number of IT employees in six different cities and the percentage male employees and female employees among them
Note: (In percentage distribution some data missing find them by calculating other data)
- What is the respective ratio of the number of female employees in Hyderabad and Mumbai together to the number of male employees in New Delhi and Kochi together?
- 48 : 77
- 39 : 56
- 7 : 9
- 7 : 13
- 65 : 49
- What is the average number of male employees in Chennai and Bangalore and female employees in New Delhi and Kochi together?
- 1025.25
- 956.25
- 972.50
- 912.25
- 873.75
- The total number of IT employees in Hyderabad, is approximately what percent of the number of male employees in New Delhi and number of female employees in Bangalore together?
- 95.23%
- 94.60%
- 93.64%
- 96.87%
- 90.45%
- What is the total percentage of male employees in Hyderabad and Kochi together (rounded off to two digits after decimal)
- 76.72
- 70.21
- 77.36
- 75.83
- 74.28
- What is the total number of male employees in Chennai, Mumbai and New Delhi together?
- 4095
- 3755
- 3975
- 3645
- 3825
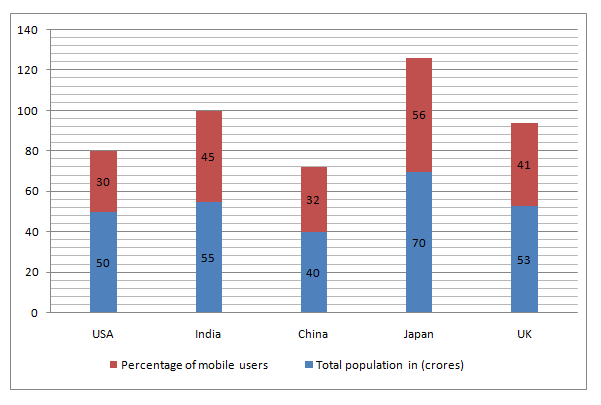
Directions (Q. 6-10): Study the Bar graphs carefully and answer the questions that follow:
The following graph shows the total population in (crores) and percentage population of mobile users from different countries:
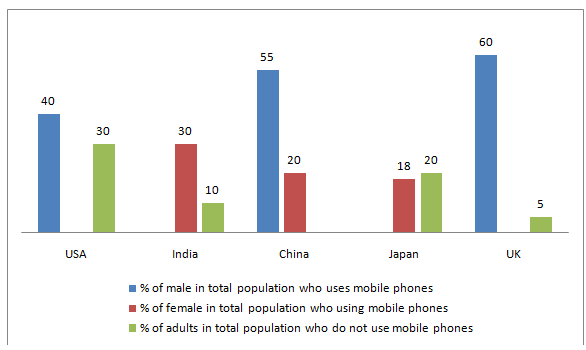
Percentage of male and female uses mobile phones and adults who did not use mobile phones:
Note: (In percentage distribution some data missing find them by calculating other data)
- What is the average number of mobile users in India, Japan and China together?
- 32.18 crore
- 18.20 crore
- 25.58 crore
- 40.98 crore
- 45.38 crore
- How many males and females who use mobile phones in China?
- 9.60 crore
- 10.20 crore
- 12.75 crore
- 14.30 crore
- 8.90 crore
- Average number of adult population who did not use mobile phones in USA, India and Japan?
- 4 crore
- 6 crore
- 5 crore
- 3 crore
- 7 crore
- How many more mobile users are there in Japan than India?
- 12.15 crore
- 14.45 crore
- 17.55 crore
- 11.85 crore
- 15.25 crore
- What is the respective ratio of adult population who did not use mobile phones in UK to males and females who use mobile phones in India?
- 2873 : 41520
- 1956 : 47770
- 3163 : 45850
- 2193 : 42550
- 2173 : 44550
Click Here for More Practice Data Interpretation Questions


🙂
Keep stay with us.
tusm.