


Data Interpretation Test Practice – Day 63 | Data Interpretation Questions:
Dear Readers, Important Practice Data Interpretation Questions for IBPS Exams 2017 was given here with Solutions. Aspirants those who are preparing for the Bank Examination and other Competitive Examination can use this material.
Click Here for More Practice Data Interpretation Questions
[WpProQuiz 810]
Click “Start Quiz” to attend these Questions and view Solutions
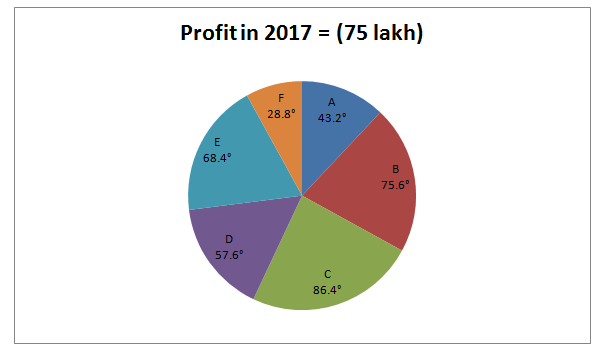
Directions (Q. 1-5): The following pie-chart shows the distribution of profit of six banks in 2015, 2016 and 2017
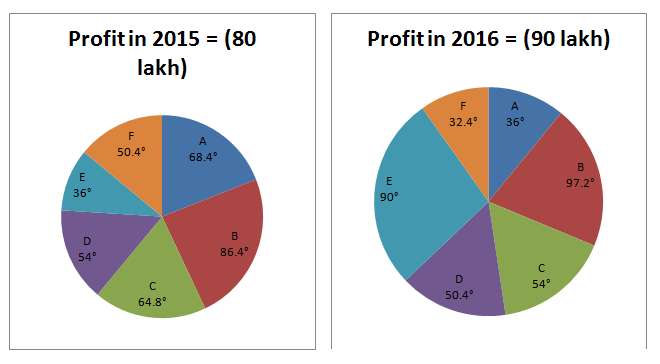
- What is the difference between the profit in 2015 on Bank B and the profit in 2016 on Bank F?
- 11.1 lakh
- 10.6 lakh
- 13.5 lakh
- 14.3 lakh
- 15.1 lakh
- What is the average profit in three years on Bank C?
- 11.3 lakh
- 15.3 lakh
- 17.6 lakh
- 14.8 lakh
- 13.9 lakh
- The profit in 2017 on Bank C is what percentage more or less than the profit in 2015 on Bank E?
- 120%
- 110%
- 135%
- 125%
- 115%
- The profit in 2017 on Bank B is approximately what percentage of the profit in 2015 on Bank D?
- 121%
- 139%
- 127%
- 135%
- 131%
- What is the ratio of the profit in 2015 on Bank C to the profit in 2016 on Bank D?
- 7 : 8
- 5 : 7
- 8 : 7
- 8 : 9
- 5 : 8
Directions (Q. 6-10): Study the column graph carefully and answer the questions given below:
The number of visitors travelled to India (in lakhs) from four different countries in different years
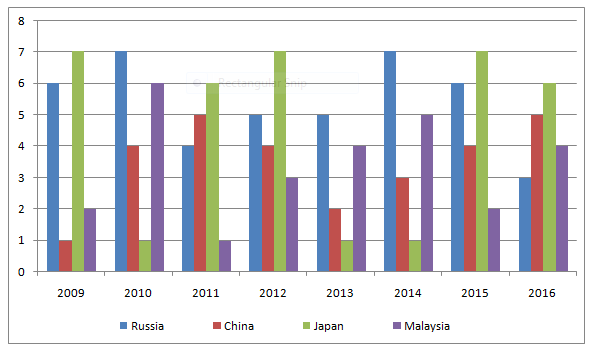
- What is the difference between the number of visitors from China in 2014 and that from Malaysia in 2009?
- 2.5 lakh
- 1 lakh
- 1.5 lakh
- 1.75 lakh
- 1.9 lakh
- The total number of visitors in 2013 is what per cent of the total number of visitors in 2016?
- 58.66%
- 82.33%
- 48.66%
- 66.67%
- 50.25%
- If the visitors go to amusement park, the entry fees for Malaysia visitors is 350 and that of China visitors is 450 for all visitors then what is the total income of for that park from both the country visitors during 2014 to 2016?
- 87.5 crore
- 95 crore
- 92.5 crore
- 77.5 crore
- 90 crore
- From which country is the number of visitors travelled to India maximum during the eight years?
- Russia
- China
- Japan
- Either Japan or China
- Malaysia
- If the visitors from Russia donate 400 rupees each for a children foundation and the each visitors from Japan donate for the same foundation 20% more than that of Russia visitors, then what is the ratio of the donation of Russia in 2015 to that of Japan in 2016?
- 3 : 10
- 5 : 9
- 4 : 7
- 6 : 5
- 5 : 6
Click Here for More Practice Data Interpretation Questions


Leave a Reply