


Data Interpretation Test Practice – Day 67 | Data Interpretation Questions:
Dear Readers, Important Practice Data Interpretation Questions for IBPS Exams 2017 was given here with Solutions. Aspirants those who are preparing for the Bank Examination and other Competitive Examination can use this material.
Click Here for More Practice Data Interpretation Questions
[WpProQuiz 864]
Click “Start Quiz” to attend these Questions and view Solutions
Directions (Q. 1-5): Study the following pie-chart carefully to answer the given questions.
Pie-chart I and pie-chart II show the percentage of number of voters in 2015 and 2016 respectively.
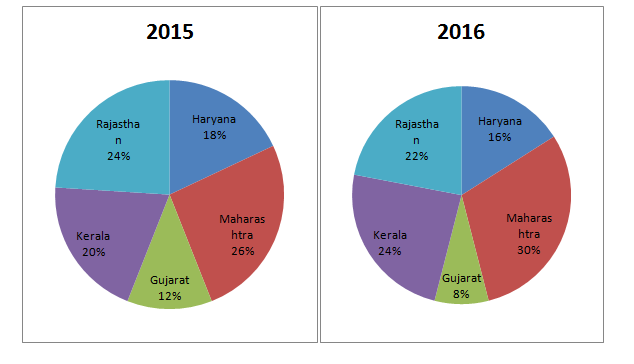
- If the total number of voters in Gujarat in 2016 is 50000 and the ratio of voters in Gujarat in 2016 to that in 2015 is 2 : 3 then what is the total number of voters in 2015?
- 515000
- 625000
- 575000
- 675000
- 725000
- If the total number of voters in other states in 2015 increases by 10% per annum then what will the number of other voters will be after 2 years? (Given that the number of other vehicles at present is 1.5 lakh)
- 181500
- 195800
- 179200
- 180500
- 183900
- If the number of voters in Kerala increases by 5% per annum, then what was the number of voters in Kerala two years ago? (Given that the number of voters in Kerala is 2.5 lakh as of now)
- 215847
- 239875
- 251437
- 202527
- 226757
- If the total voters in 2015 is 1200000 and the ratio of voters in Maharashtra in 2015 to that in 2016 is 3 : 5, then what is the total number of voters in 2016? (You are not expected to calculate the exact value.)
- 18.5 lakh
- 19.3 lakh
- 17.3 lakh
- 16.3 lakh
- 15.4 lakh
- If the total voters in 2016 are 859000 and the total voters in 2015 are 786000 then what is the ratio between the number of voters in Rajasthan in 2016 and that number of voters in Maharashtra in 2015?
- 47418 : 36896
- 51996 : 54786
- 63786 : 45072
- 9449 : 10218
- None of these
Directions (Q. 6-10): In a state total number of graduates passed in six different streams in three classes First class, Second class and Third class. The following table shows the total graduates passed in different stream and the ratios of First class, Second class and Third class among them.
| Stream | Total Graduates | Ratio |
| First class : Second class : Third class | ||
| B.sc Maths | 61880 | 21 : 23 : 24 |
| B.sc Physics | 73130 | 25 : 24 : 22 |
| BBA | 77490 | 23 : 18 : 22 |
| B.sc Chemistry | 93160 | 3 : 5 : 9 |
| BCA | 61050 | 19 : 15 : 21 |
| B. Com | 80370 | 25 : 23 : 9 |
- What is the difference of difference between the total number of First class graduates and Third class graduates passed in B.sc Physics to difference between the total number of First class graduates and Third class graduates passed in BBA?
- 1860
- 2050
- 1790
- 1970
- 1820
- The total number of First class graduates passed in B.sc Maths is approximately what per cent more/less than the total number of First class graduates passed in B.sc Chemistry?
- 14.75%
- 12.65%
- 13.95%
- 16.25%
- 20.15%
- The total number of Second class graduates passed in B. Com and B.sc Chemistry together is approximately what per cent of the total number of Third class graduates passed in BBA and B.sc Physics together?
- 125%
- 95%
- 120%
- 108%
- 130%
- What is the total number of First class graduates passed in B. Com and BCA together?
- 54680
- 52950
- 56520
- 59630
- 56340
- What is the total number of Second class graduates passed in all six streams together?
- 141250
- 144270
- 149320
- 145410
- 140270
Click Here for More Practice Data Interpretation Questions


ques 2
vehicles word
which is not appropriate
correct it