


Data Interpretation Test Practice – Day 72 | Data Interpretation Questions:
Dear Readers, Important Practice Data Interpretation Questions for IBPS Exams 2017 was given here with Solutions. Aspirants those who are preparing for the Bank Examination and other Competitive Examination can use this material.
Click Here for More Practice Data Interpretation Questions
[WpProQuiz 926]
Click “Start Quiz” to attend these Questions and view Solutions
Direction (Q. 1-5): Study the following graphs carefully and answer the questions that follow:
Production of Rice and Wheat (In thousands):
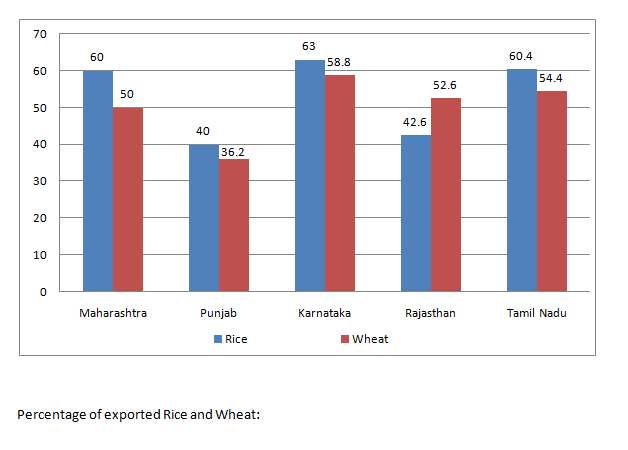
- What is average number of Wheat’s produced by Punjab, Karnataka, Rajasthan and Tamil Nadu together?
- 52500
- 50500
- 50100
- 48600
- 59800
- Rice used for Domestic purpose of Maharashtra and Punjab is approximately what percent of the Rice used for domestic purpose of Karnataka and Tamil Nadu?
- 75 %
- 63 %
- 72 %
- 78 %
- 80 %
- What is the average number of Wheat’s exported by Maharashtra, Karnataka and Tamil Nadu?
- 13568
- 11298
- 12468
- 12048
- 14158
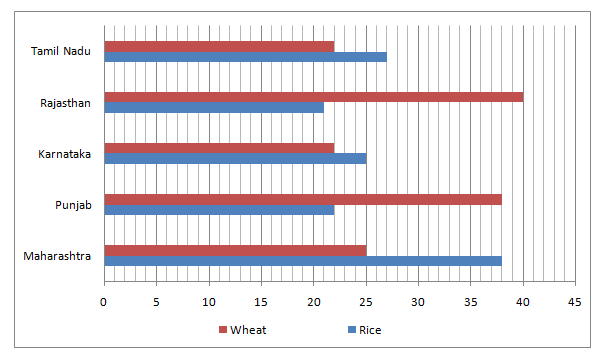
- What is the respective ratio between Rice exported by Punjab, Karnataka and Wheat’s exported by same states?
- 26560 : 28786
- 20450 : 22357
- 22810 : 24693
- 29650 : 31462
- 24550 : 26692
- Wheat’s exported by Rajasthan and Tamil Nadu is what per cent more/less than the Wheat’s exported by Maharashtra and Punjab?
- 20 %
- 10 %
- 30%
- 25%
- 35 %
Directions (Q. 6-10): Study the following bar charts carefully and answer the following questions. The bar–chart shows the percentage distribution of total graduates among different states in the country and another bar graph shows the ratio of under graduates to post graduates among them
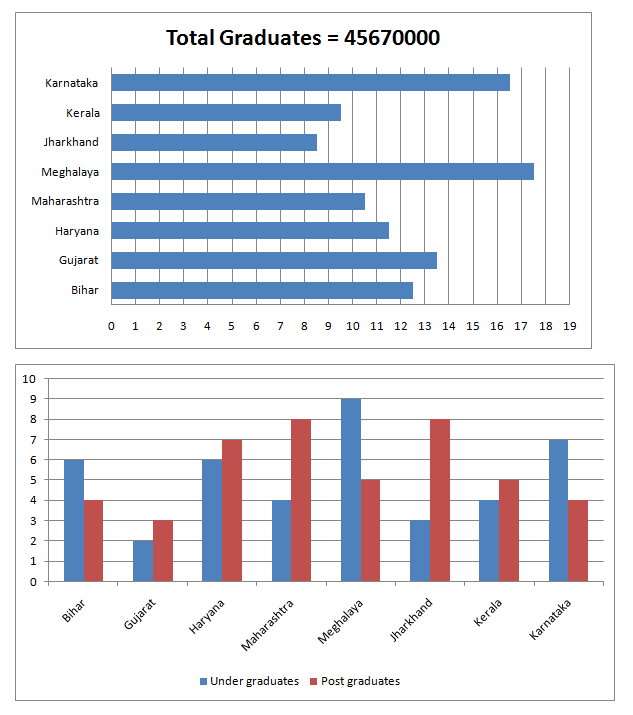
- What is the ratio of under graduates in Meghalaya to Post graduates in Kerala? (Approximately)
- 83 : 43
- 81: 47
- 38 : 81
- 81 : 38
- None of these
- What is the total number of Post graduates in Jharkhand, Kerala and Karnataka?
- 7954786
- 7973107
- 7963589
- 7383484
- 7973797
- What is the total number of under graduates in Maharashtra, Meghalaya and Kerala? (Approximately)
- 8692314
- 8678514
- 8664614
- 8657414
- 8602714
- What is the number of total graduates from Bihar, Gujarat and Meghalaya?
- 19866450
- 19855140
- 19722780
- 19478520
- 19945890
- The number of under graduates in Maharashtra, Meghalaya and Jharkhand is what percent of total number of graduates in the all states together?
- 19
- 17
- 21
- 23
- 28
Click Here for More Practice Data Interpretation Questions


i did only 5 questions out of 7min…. is it possible to do 10 questions out of 7min these kinds of questions?
If you are practicing well, it will be easy one.
Dear IB why i unable do right click
For some copy right issues.
kindly resolve this issue….if possible
still any can copy from mobile or tap , Most of the aspirants using mobile and those people only copy the content post it in grade up app, but really annoying for PC user unable to open many post at the time
still any can copy from mobile or tap , Most of the aspirants using mobile and those people only copy the content post it in grade up app, but really annoying for PC user unable to open many post at the time
kindly Understand the things, some of them Copy our content and using in their websites without our knowledge,and mobile users cant do this regularly. we restrict to copy mobile browsers also but some of browsers allows to copy. sry fr the inconvenience
you can use “Ctrl+left click” to open in new tab.
thank you