


Data Interpretation Test Practice – Day 79 | Data Interpretation Questions:
Dear Readers, Important Practice Data Interpretation Questions for IBPS Exams 2018 was given here with Solutions. Aspirants those who are preparing for the Bank Examination and other Competitive Examination can use this material.
Click Here for More Practice Data Interpretation Questions
[WpProQuiz 1047]
Click “Start Quiz” to attend these Questions and view Solutions
Direction (Q. 1-5): Study the following graph carefully and answer the questions that follow:
The line graph shows the production of petrol in various countries in different years. Productions in Lakhs
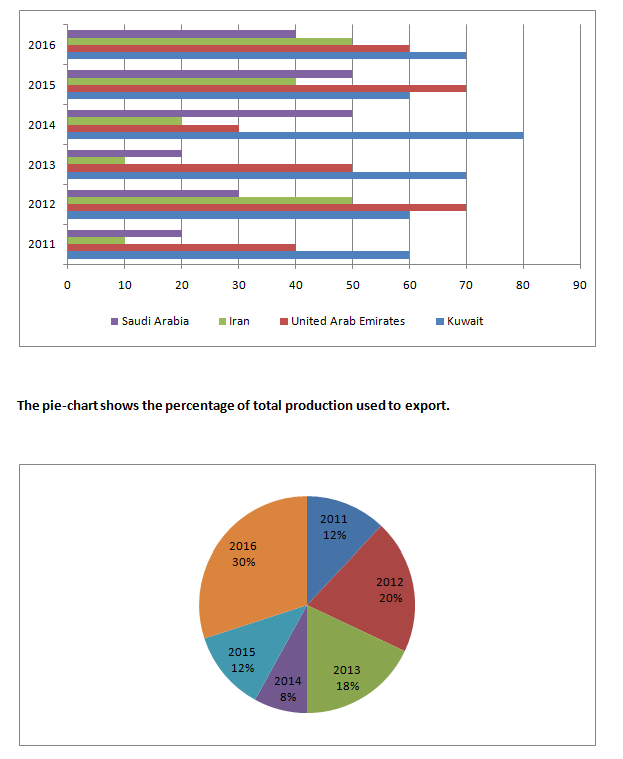
- Total production of petrol in 2016 is what per cent more than that in 2011?
- 64.56%
- 72.84%
- 89.29%
- 56.15%
- 69.23%
- What is the ratio of petrol used for export in 2014 to 2011?
- 3 : 7
- 14 : 15
- 2 : 5
- 12 : 13
- 7 : 11
- What is the difference between the volume of petrol used for export in 2016 and that in 2012?
- 24 lakh litres
- 28 lakh litres
- 32 lakh litres
- 35 lakh litres
- 34 lakh litres
- In which country is the production of petrol maximum over six years?
- Iran
- Kuwait
- United Arab Emirates
- Saudi Arabia
- Both Saudi Arabia and Iran
- The petrol used for export in 2013 is what per cent of the petrol used for export in 2015?
- 210%
- 106.58%
- 102.27%
- 125.98%
- 97.05%
Direction (Q. 6-10): Following radar graph shows the ratio of exports to imports of two fruits Apple and Grapes over the period 2011 to 2017.
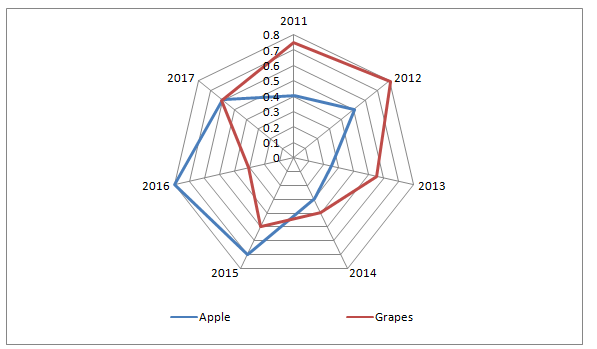
- If the import of Apple in year 2016 and export of Grapes in year 2017 are 86 lakh and 51 lakh respectively, what is the sum of export of Apple in 2016 and import of Grapes in 2017?
- 152.6 lakh
- 153.8 lakh
- 154.2 lakh
- 158.3 lakh
- 151.9 lakh
- If the export of Apple in year 2014 and that of Grapes in year 2011 were 23.4 lakh and 72 lakh respectively, then the import of Apple in year 2014 is what percentage of the import of Grapes in year 2011?
- 87.50%
- 83.70%
- 81.25%
- 92.50%
- 78.25%
- If the import of Apple in 2013 was 96.8 lakh, what was the export of Apple in that year?
- 24.2 lakh
- 26.8 lakh
- 32.6 lakh
- 28.8 lakh
- 30.6 lakh
- If in year 2014 the export of Grapes is increased by 125% and its import is decreased by 60%, what will the new ratio of export to import of Grapes in 2014?
- 4 : 3
- 2 : 5
- 4 : 9
- 7 : 3
- 9 : 4
- The ratio of export to import of Grapes in year 2013 was what percentage of the ratio of export to import of Apple in year 2011?
- 132.5%
- 117.5%
- 152.5%
- 137.5%
- 122.5%
Click Here for More Practice Data Interpretation Questions


Leave a Reply