


Dear Readers, SBI is conducting Online Examination for the recruitment of Clerical Cadre and probationary officer. To enrich your preparation here we have providing new series of Data Interpretation – Quantitative Aptitude Questions. Candidates those who are appearing in SBI Clerk/PO Prelims Exams can practice these Quantitative Aptitude average questions daily and make your preparation effective.
[WpProQuiz 2378]Click “Start Quiz” to attend these Questions and view Solutions
Click here to view Quantitative Aptitude Questions in Hindi
Directions (Q. 1 – 5) Study the following information carefully and answer the given questions:
Following table shows the percentage distribution of population of different age groups of five different cities.
| City | 0 < Age ≤ 12 | 12< Age ≤ 18 | 18< Age ≤ 34 | 34< Age ≤ 60 | Age above 60 |
| P | 12 % | 22 % | 28 % | 23 % | 15 % |
| Q | 10 % | 24 % | 20 % | 29 % | 17 % |
| R | 13 % | 18 % | 25 % | 28 % | 16 % |
| S | 15 % | 19 % | 21 % | 27 % | 18 % |
| T | 20 % | 24 % | 23 % | 21 % | 12 % |
- If the number of people in the age group of 12- 18 years in the city P is 33000, then find the number of people in the age group of 34 – 60 years in city P?
- 28700
- 38300
- 34500
- 42000
- None of these
- If the number of people in the age group of above 60 years in city S is 45000, then the total number of people in the age group of 0 – 12 years is approximately what percentage of total number of people in the age group of 18 – 34 years in city S?
- 78 %
- 71 %
- 57 %
- 84 %
- 92 %
- If the number of people in the age group of 18 – 34 years of city R and T is 75000 and 34500 respectively, then find the sum of the number of people in the age group of 34 – 60 years in city R and the number of people in the age group of 0 – 12 years in city T?
- 105600
- 97500
- 88300
- 114000
- None of these
- If the number of people in the age group of 12 – 18 years in city Q and R is 43200 and 54000 respectively, then the ratio of total population of city Q to that of city R?
- 3 : 5
- 5 : 7
- 4 : 9
- 2 : 3
- None of these
- If the total population of city P and S is 150000 and 250000 respectively, then the total number of people in the age group of 18 – 34 years in city P is approximately what percentage more/less than the total number of people in the age group of 12 – 18 years in city S?
- 20%
- 15%
- 12%
- 18%
- 24%
Directions (Q. 6 – 10) Study the following information carefully and answer the given questions:
The survey was conducted among 7200 villagers from various villages having various favourite fruits and the pie chart shows the percentage distribution among the people and the table shows the ratio of male and female among them.
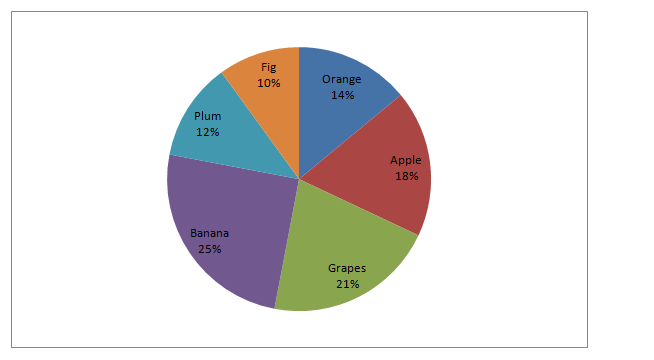
| Favourite fruits | Male : Female |
| Orange | 7 : 2 |
| Apple | 1 : 3 |
| Grapes | 5 : 4 |
| Banana | 4 : 5 |
| Plum | 1 : 1 |
| Fig | 2 : 7 |
- Total number of males who likes Apple and Banana together is approximately what percentage more/less than the total number of males who likes Plum and Fig together?
- 80 %
- 75 %
- 85 %
- 90 %
- 95 %
- Find the total females who like all the given fruits together?
- 3860
- 5280
- 4470
- 4890
- 5530
- Find the ratio between the total number of females who likes Orange and Grapes together to that of total number of females who likes Banana and Fig together?
- 98 : 173
- 152 : 257
- 112 : 195
- 178 : 245
- None of these
- Find the difference between the total number of males to that of total number of females, likes all the given fruits together?
- 640
- 520
- 480
- 590
- 660
- Find the total number of persons who likes Orange, Banana and Plum together is approximately what percentage of total number of persons who likes Apple, Grapes and Fig together?
- 95 %
- 112 %
- 104 %
- 87 %
- 71 %
Answers:
Directions (Q. 1 – 5)
- Answer c
The number of people in the age group of 12- 18 years in the city P = 33000
22 % of total number of people in city P = 33000
(22/100)* Total number of people in city P = 33000
Total number of people in city P = 33000*(100/22) = 150000
The number of people in the age group of 34 – 60 years in city P
= > 23 % of total people
= > (23/100)*150000
= > 34500
- Answer b
The number of people in the age group of above 60 years in city S = 45000
18 % of total number of people in city S = 45000
Total number of people in city S = 45000*(100/18) = 250000
The total number of people in the age group of 0 – 12 years in city S
= > 250000*(15/100) = 37500
The total number of people in the age group of 18 – 34 years in city S
= > 250000*(21/100) = 52500
Required % = (37500/52500)*100 = 71.45 % = 71 %
- Answer d
The number of people in the age group of 18 – 34 years of city R = 75000
25 % of total number of people in city R = 75000
Total number of people in city R = 75000*(100/25) = 300000
The number of people in the age group of 34 – 60 years in city R
= > 300000*(28/100) = 84000
The number of people in the age group of 18 – 34 years of city T = 34500
23 % of total number of people in city T = 34500
Total number of people in city T = 34500*(100/23) = 150000
The number of people in the age group of 0 – 12 years in city T
= > 150000*(20/100) = 30000
Required sum = 84000 + 30000 = 114000
- Answer a
The number of people in the age group of 12 – 18 years in city Q = 43200
24 % of total number of people in city Q = 43200
Total number of people in city Q = 43200*(100/24) = 180000
The number of people in the age group of 12 – 18 years in city R = 54000
18 % of total number of people in city R = 54000
Total number of people in city R = 54000*(100/18) = 300000
Required ratio = 180000: 300000 = 18: 30 = 3: 5
- Answer c
The total population of city P = 150000
The total population of city S = 250000
The total number of people in the age group of 18 – 34 years in city P
= > 150000*(28/100) = 42000
The total number of people in the age group of 12 – 18 years in city S
= > 250000*(19/100) = 47500
Required percentage = (47500-42000)/47500*100
=11.57 % = 12%
Directions (6-10):
| Favourite fruits | Total number of people | Male | Female |
| Orange | 1008 | 784 | 224 |
| Apple | 1296 | 324 | 972 |
| Grapes | 1512 | 840 | 672 |
| Banana | 1800 | 800 | 1000 |
| Plum | 864 | 432 | 432 |
| Fig | 720 | 160 | 560 |
- Answer d
Total number of males who likes Apple and Banana together
= > 324 + 800 = 1124
Total number of males who likes Plum and Fig together
= > 432 + 160 = 592
Required % = [(1124 – 592)/592]*100 = (532/592)*100
= > 89.86 % = 90 %
- Answer a
The Total females who likes all the given fruits together
= > 224 + 972 + 672 + 1000 + 432 + 560
= > 3860
- Answer c
The total number of females who likes Orange and Grapes together
= > 224 + 672 = 896
The total number of females who likes Banana and Fig together
= > 1000 + 560 = 1560
Required ratio = 896: 1560 = 112: 195
- Answer b
The total number of males who likes all the given fruits together
= > 784 + 324 + 840 + 800 + 432 + 160
= > 3340
The total number of females who likes all the given fruits together
= > 224 + 972 + 672 + 1000 + 432 + 560
= > 3860
Required difference = 3860 – 3340 = 520
- Answer c
Required % = [(14 + 25 + 12)/(18 + 21 + 10)]*100
= > (51/49)*100 = 104.08 % = 104 %
Daily Practice Test Schedule | Good Luck
| Topic | Daily Publishing Time |
| Daily News Papers & Editorials | 8.00 AM |
| Current Affairs Quiz | 9.00 AM |
| Quantitative Aptitude “20-20” | 11.00 AM |
| Vocabulary (Based on The Hindu) | 12.00 PM |
| General Awareness “20-20” | 1.00 PM |
| English Language “20-20” | 2.00 PM |
| Reasoning Puzzles & Seating | 4.00 PM |
| Daily Current Affairs Updates | 5.00 PM |
| Data Interpretation / Application Sums (Topic Wise) | 6.00 PM |
| Reasoning Ability “20-20” | 7.00 PM |
| English Language (New Pattern Questions) | 8.00 PM |
Click Here for More Quantitative Aptitude Questions


