


Dear Readers, SBI is conducting Online Examination for the recruitment of Clerical Cadre and probationary officer. To enrich your preparation here we have providing new series of Data Interpretation – Quantitative Aptitude Questions. Candidates those who are appearing in SBI Clerk/PO Prelims Exams can practice these Quantitative Aptitude average questions daily and make your preparation effective.
[WpProQuiz 2492]
Click “Start Quiz” to attend these Questions and view Solutions
Click here to view Quantitative Aptitude Questions in Hindi
Directions (Q. 1 – 5) Study the following information carefully and answer the given questions:
Following table shows the total number of medals won by five different countries in six commonwealth games.
| Australia | England | Canada | India | New Zealand | |
| 1998 | 198 | 136 | 99 | 25 | 34 |
| 2002 | 207 | 165 | 116 | 69 | 45 |
| 2006 | 221 | 110 | 86 | 50 | 32 |
| 2010 | 177 | 142 | 75 | 101 | 36 |
| 2014 | 137 | 174 | 85 | 64 | 45 |
| 2018 | 198 | 136 | 82 | 66 | 46 |
- Total number of medals won by Australia, Canada and New Zealand in the year 1998, 2006 and 2014 together is approximately what percentage of total number of medals won by England, Canada and India in the year 2002, 2010 and 2018 together?
- 116 %
- 98 %
- 84 %
- 72 %
- 107 %
- Find the difference between the total number of medals won by Australia to that of Canada in all the given years together?
- 432
- 397
- 613
- 595
- None of these
- Find the ratio between the total number of medals won by England and India together to that of Canada and New Zealand together for all the given years together?
- 652 : 257
- 554 : 119
- 1238 : 781
- 967 : 564
- None of these
- Which country had won least medals from 1998 to 2018?
- New Zealand
- India
- Canada
- England
- Australia
- Total number of medals won by all the given countries together in the year 2006 and 2010 together is what percentage less than the total number of medals won by all the given countries together in the year 2014 and 2018 together?
- 57 %
- 12 %
- 29 %
- 45 %
- None of these
Directions (Q. 6 – 10) Study the following information carefully and answer the given questions:
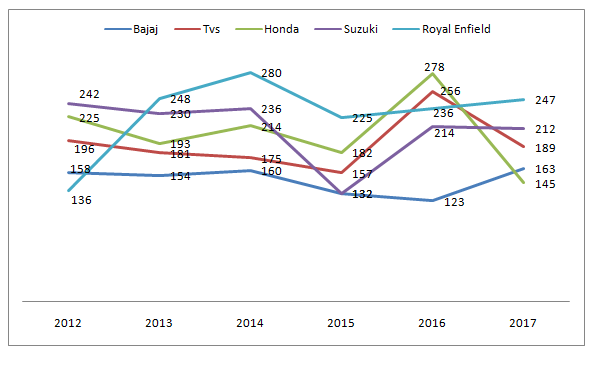
Following line graph shows the annual sales (in lakhs) of two wheelers of five different companies in India in the year 2012 to 2017.
- Find the difference between the total annual sales of Bajaj to that of Suzuki of all the given years together?
- 245 lakhs
- 376 lakhs
- 324 lakhs
- 297 lakhs
- None of these
- Find the ratio between the total annual sales in the year 2013 and 2014 of all the given two wheeler companies to that of total annual sales in the year 2016 and 2017 of all the given two wheeler companies?
- 2071 : 2063
- 1145 : 1082
- 238 : 219
- 586 : 475
- None of these
- Total annual sales of Honda for all the given years together is approximately what percentage of total annual sales of Royal Enfield of all the given years together?
- 115 %
- 75 %
- 90 %
- 55 %
- 100 %
- Find the average annual sales in the year 2013, 2015 and 2017 together of all the given two wheeler companies
- 680 lakhs
- 740 lakhs
- 850 lakhs
- 930 lakhs
- None of these
- Total annual sales of Suzuki in the year 2012, 2014 and 2016 together is approximately what percentage more/less than the total annual sales of TVS in the year 2013, 2015 and 2017 together?
- 31 % more
- 45 % less
- 31 % less
- 45 % more
- 57 % less
Answers:
Directions (Q. 1 – 5)
1. Answer b
Total number of medals won by Australia, Canada and New Zealand in the year 1998, 2006 and 2014 together
= > 198 + 99 + 34 + 221 + 86 + 32 + 137 + 85 + 45
= > 937
Total number of medals won by England, Canada and India in the year 2002, 2010 and 2018 together
= > 165 + 116 + 69 + 142 + 75 + 101 + 136 + 82 + 66
= > 952
Required % = (937/952)*100 = 98.42 % = 98 %
2. Answer d
The total number of medals won by Australia in all the given years together
= > 198 + 207 + 221 + 177 + 137 + 198 = 1138
The total number of medals won by Canada in all the given years together
= > 99 + 116 + 86 + 75 + 85 + 82 = 543
Required difference = 1138 – 543 = 595
3. Answer c
The total number of medals won by England and India together for all the given years together
= > 136 + 165 + 110 + 142 + 174 + 136 + 25 + 69 + 50 + 101 + 64 + 66
= > 1238
The total number of medals won by Canada and New Zealand together for all the given years together
= > 99 + 116 + 86 + 75 + 85 + 82 + 34 + 45 + 32 + 36 + 45 + 46
= > 781
Required ratio = 1238: 781
4. Answer a
Australia = > 198 + 207 + 221 + 177 + 137 + 198 = 1138
England = > 136 + 165 + 110 + 142 + 174 + 136 = 863
Canada = > 99 + 116 + 86 + 75 + 85 + 82 = 543
India = > 25 + 69 + 50 + 101 + 64 + 66 = 375
New Zealand = > 34 + 45 + 32 + 36 + 45 + 46 = 238
New Zealand had won least number of medals.
5. Answer c
Total number of medals won by all the given countries together in the year 2006 and 2010 together
= > 221 + 110 + 86 + 50 + 32 + 177 + 142 + 75 + 101 + 36
= > 1030
The total number of medals won by all the given countries together in the year 2014 and 2018 together
= > 137 + 174 + 85 + 64 + 45 + 198 + 136 + 82 + 66 + 46
= > 1033
Required % = [(1033 – 1030)/1033]*100 = 0.29 %
Directions (Q. 6 – 10)
6. Answer b
The total annual sales of Bajaj of all the given years together
= > 158 + 154 + 160 + 132 + 123 + 163
= > 890 lakhs
The total annual sales of Suzuki of all the given years together
= > 242 + 230 + 236 + 132 + 214 + 212
= > 1266 lakhs
Required difference = 1266 – 890 = 376 lakhs
7. Answer a
The total annual sales in the year 2013 and 2014 of all the given two wheeler companies
=>154 + 181 + 193 + 230 + 248 + 160 + 175 + 214 + 236 + 280
= > 2071 lakhs
The total annual sales in the year 2016 and 2017 of all the given two wheeler companies
= > 123 + 256 + 278 + 214 + 236 + 163 + 189 + 145 + 212 + 247
= > 2063 lakhs
Required ratio = 2071: 2063
8. Answer c
Total annual sales Honda of all the given years together
= > 225 + 193 + 214 + 182 + 278 + 145
= > 1237 lakhs
Total annual sales of Royal Enfield of all the given years together
= > 136 + 248 + 280 + 225 + 236 + 247
= > 1372 lakhs
Required % = (1237/1372)*100 = 90.16 % = 90 %
9. Answer d
The total annual sales in the year 2013, 2015 and 2017 together of all the given two wheeler companies
= > 154 + 181 + 193 + 230 + 248 + 132 + 157 + 182 + 132 + 225+ 163 + 189 + 145 + 212 + 247
= > 2790 lakhs
Required average = 2790/3 = 930 lakhs
10. Answer a
Total annual sales of Suzuki in the year 2012, 2014 and 2016 together
= > 242 + 236 + 214 = 692 lakhs
Total annual sales of TVS in the year 2013, 2015 and 2017 together
= > 181 + 157 + 189 = 527 lakhs
Required % = [(692 – 527)/527]*100 = 31.3 % = 31 % more
Daily Practice Test Schedule | Good Luck
| Topic | Daily Publishing Time |
| Daily News Papers & Editorials | 8.00 AM |
| Current Affairs Quiz | 9.00 AM |
| Quantitative Aptitude “20-20” | 11.00 AM |
| Vocabulary (Based on The Hindu) | 12.00 PM |
| General Awareness “20-20” | 1.00 PM |
| English Language “20-20” | 2.00 PM |
| Reasoning Puzzles & Seating | 4.00 PM |
| Daily Current Affairs Updates | 5.00 PM |
| Data Interpretation / Application Sums (Topic Wise) | 6.00 PM |
| Reasoning Ability “20-20” | 7.00 PM |
| English Language (New Pattern Questions) | 8.00 PM |

Leave a Reply