


Dear Readers, Exam Race for the Year 2019 has already started, To enrich your preparation here we are providing new series of Practice Questions on Quantitative Aptitude – Section for CWC/FCI Exam. Aspirants, practice these questions on a regular basis to improve your score in aptitude section. Start your effective preparation from the right beginning to get success in upcoming CWC/FCI Exam.
[WpProQuiz 5703]Click Here to Take FCI Prelims Mock Test
Click Here to Take CWC Prelims Mock Test
Directions (Q. 1 – 5): Find the Missing term in the following number series?
1) 208, 104, 156, 390, ? , 6142.5
a) 1450
b) 2175
c) 1365
d) 2890
e) 3345
2) 155, 200, 248, 305, 389, ?
a) 554
b) 478
c) 512
d) 596
e) 620
3) 45, 48, 102, 315, 1272, ?
a) 5125
b) 5530
c) 6145
d) 6375
e) 4560
4) 42, 22, 30, 87, ? , 3421
a) 536
b) 412
c) 624
d) 748
e) 856
5) 7020, 3510, 1170, 292.5, ? , 9.75
a) 106.25
b) 76.5
c) 58.5
d) 62.5
e) 95.25
Directions (Q. 6 – 10): Study the following information carefully and answer the given questions:
The following table shows the total production of rice (In tons) in 5 different years in a certain state.
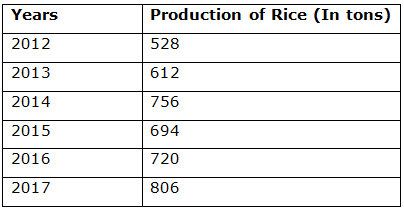
6) Find the difference between the total production of rice in the year 2012 and 2014 together to that of total production of rice in the year 2015 and 2017 together?
a) 216
b) 278
c) 324
d) 192
e) None of these
7) There are 3 categories (A1, A2 and A3) of rice cultivated in the state. If the ratio of production of A1, A2 and A3 category rice in the year 2013 and 2016 is 3 : 4 : 2 and 5 : 1 : 3 respectively, then find the ratio of production of A2 category rice in the year 2013 to that A3 category rice in the year 2016?
a) 25: 23
b) 37: 35
c) 12: 7
d) 17: 15
e) None of these
8) Find the average production of rice in all the given years together?
a) 715
b) 686
c) 758
d) 627
e) None of these
9) Total production of rice in the year 2014 is approximately what percentage of total production of rice in the year 2017?
a) 94 %
b) 108 %
c) 82 %
d) 75 %
e) 66 %
10) Find the difference between the average production of rice in the year 2012, 2014 and 2016 together to that of the average production of rice in the year 2013, 2015 and 2017 together?
a) 44
b) 52
c) 36
d) 68
e) None of these
Answers :
Direction (1-5) :
1) Answer: c)
The pattern is, *1/2, *3/2, *5/2, *7/2, *9/2,….
The answer is, 1365
2) Answer: a)
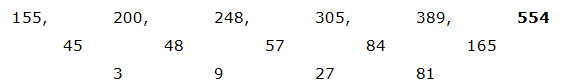
The difference of difference is, *3
The answer is, 554
3) Answer: d)
The pattern is, *1 + 3, *2 + 6, *3 + 9, *4 + 12, *5 + 15,….
The answer is, 6375
4) Answer: b)
The pattern is, *0.5 + 13, *1 + 23, *2 + 33, *4 + 43, *8 + 53,….
The answer is, 412
5) Answer: c)
The pattern is, ÷ 2, ÷ 3, ÷ 4, ÷ 5, ÷ 6,….
The answer is, 58.5
Direction (6-10) :
6) Answer: a)
The total production of rice in the year 2012 and 2014 together
= > 528 + 756 = 1284
The total production of rice in the year 2015 and 2017 together
= > 694 + 806 = 1500
Required difference = 1500 – 1284 = 216
7) Answer: d)
Production of A2 category rice in the year 2013
= > 612*(4/9) = 272
Production of A3 category rice in the year 2016
= > 720*(3/9) = 240
Required ratio = 272: 240 = 17: 15
8) Answer: b)
The average production of rice in all the given years together
= > (528 + 612 + 756 + 694 + 720 + 806)/6
= > 4116/6 = 686
9) Answer: a)
Total production of rice in the year 2014 = 756
Total production of rice in the year 2017 = 806
Required % = (756/806)*100 = 94 %
10) Answer: c)
The average production of rice in the year 2012, 2014 and 2016 together
= > (528 + 756 + 720)/3 = 2004/3 = 668
The average production of rice in the year 2013, 2015 and 2017 together
= > (612 + 694 + 806)/3 = 2112/3 = 704
Required difference = 704 – 668 = 36


