


Data Interpretation Test Practice – Day 34 | Data Interpretation Questions:
Dear Readers, Important Practice Data Interpretation Questions for IBPS Exams 2017 was given here with Solutions. Aspirants those who are preparing for the Bank Examination and other Competitive Examination can use this material.
[WpProQuiz 520]Directions (Q. 1-5): In the following pie charts the percentage of employees of TCS Company working in eight different cities has been given. Study these pie-charts carefully to answer the questions.
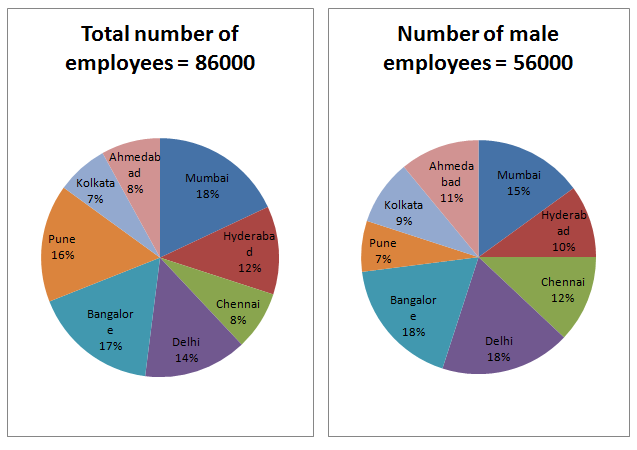
1)What is the approximate average number of male employees in Mumbai, Hyderabad and Chennai?
- 7860
- 6097
- 6907
- 6507
- 6157
2) By what per cent is the total number of employees in Bangalore, Pune and Kolkata more than the number of male employees working in Hyderabad, Chennai and Delhi?
- 2%
- 6%
- 8%
- 4%
- 2%
3)What is the average number of female employees in Delhi and Kolkata?
- 1670
- 1970
- 1270
- 1470
- 1070
4)What is the ratio between the number of male employees and female employees in Hyderabad?
- 75 : 56
- 70 : 31
- 70 : 59
- 59 : 70
- 70 : 69
5)If an increase of 40% is made in the average number of female employees, working in Chennai, Delhi and Bangalore, then their resulting average number will be what per cent of the average number of female employees?
- 83%
- 89%
- 75%
- 96%
- 70%
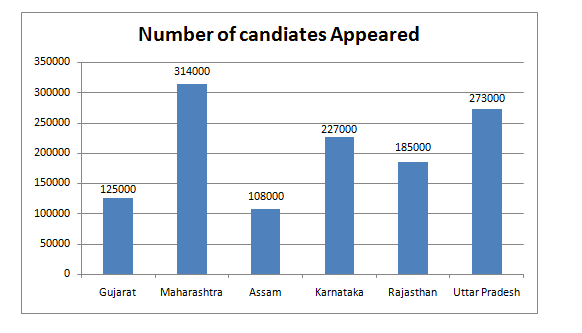
Directions (Q. 6-10): Study the graphs carefully and answer the questions that follow:
The bar graph shows the number of candidates appeared in IBPS RRB Office Assistant examination from six different states and another bar graph shows the ratio of candidates passed and failed in the states
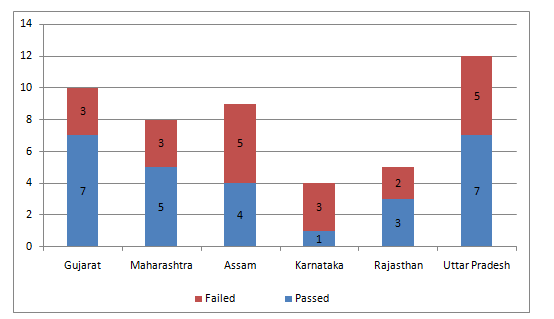
6) What is the respective ratio of the number of candidates failed in the Exam from Karnataka and Rajasthan together to those failed in the exam from Gujarat and Maharashtra together?
- 927 : 623
- 621 : 977
- 977 : 621
- 947 : 459
- 927 : 611
7) The number of candidates passed from Rajasthan and Assam together is what percent of the total number of failed candidates from Karnataka?
- 78%
- 28%
- 49%
- 01%
- 39%
8) The number of candidates appearing for the exam from Assam and Gujarat together is what percent of the total number of candidates appearing for the exam from Maharashtra and Uttar Pradesh together? (rounded off to the nearest integer)
- 45
- 40
- 35
- 33
- 30
9) Number of candidates passing in the exam from Uttar Pradesh is what percent of the total number of candidates appearing from all the States together? (rounded off to two digits after the decimal)
- 93
- 46
- 84
- 27
- 52
10) What is the difference between the state has the highest number of passing students in the exam to the state has the lowest number of students failed in the exam?
- 132250
- 168350
- 164450
- 158750
- 148950
[WpProQuiz 520]


Sir ye question Hindi me nhi h Kya…..