


Caselet DI for bank PO prelims exams are available here. Caselet DI is an important type in the data interpretation topic. In quantitative aptitude DI is a very important topic to score marks. In the SBI PO & IBPS PO prelims exams, you can expect at least 2 sets of DI, covering a total of 10 to 12 marks. Many candidates will skip the caselet DI in the exam. But if you practice well, you can easily solve the caselet DI questions. So, practice more caselet DI for bank exams. Here we have provided various models of Caselet DI for bank PO prelims exams. For your regular practice, you can utilize these caselet DI pdf and quiz.
What is caselet DI? – In the caselet DI, they will give the data in wordings. You have to study and interpret the data correctly. Then you will have to calculate as per the given data and complete the DI. In this way you can able to solve the questions in caselet DI.
Banking & Insurance Exam Study Materials
Importance of Caselet DI for Bank PO Prelims Exams
Here we have discussed the importance of caselet DI for bank PO prelims exams..
- If you solve a caselet DI, then you can easily solve 4 to 5 questions in that set.
- If you are weak in application sums, then you can go for caselet DI in the exam..
- Easy to medium level caselet DI questions can be solved within 3 to 4 minutes. SO, it will fetch you around 5 marks.
So, candidates practice all the sets of caselet DI for bank PO prelims exams here.
Start Quiz
Direction (1-5): Study the following information carefully and answer the questions given below.
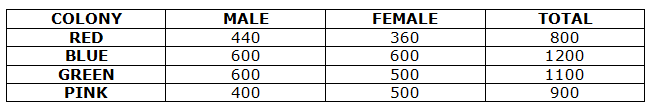
Total number of people in the Colony is 4000 and each of them live four different colours of flats – Red, Blue, Green and Pink. Total number of people live Green flat is 1100. Number of males who live in Red flat is 55% of the total number of people in the Colony who live in Red flat. The ratio of the number of males to females live in Pink flat on the colony is 4:5. The ratio of the number of males who live in Blue flat to Pink flat is 3:2. Number of males who live Green flat is 20% more than the number of females who live Pink flat. The ratio of the number of people who live Red and Blue colour flat in the ratio of 2:3 and the ratio of the number of people live Blue to Pink colour flat is 4:3.
1) What is the difference between the number of females who live in Green flat and the number of males who live in Red flat?
A.60
B.50
C.40
D.70
E.80
2) What is the total number of females who live in the colony?
A.1820
B.1850
C.1870
D.1920
E.1960
3) The number of males who lives in Pink flat is approximately what percent of the total number of people who live in Blue flat?
A.29%
B.31%
C.33%
D.35%
E.37%
4) The total number of males who live in the colony is approximately what percent of the total number of people who live in the colony?
A.48%
B.51%
C.53%
D.55%
E.None of these
5) What is the ratio of the number of females who live in Red flat to the number of females who live in Blue flat?
A.2:3
B.4:5
C.5:6
D.7:6
E.None of these
Direction (6-10): Read the information carefully and answer the following questions.
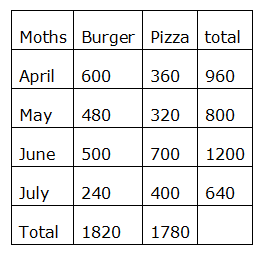
A Bakery man sold two types of product Burger and Pizza on four different months April, May, June and July. Total products sold in June is 1200 which is 25% more than total products sold in April. Ratio of number of Burgers and Pizzas sold in month of April is in ratio of 5:3. Number of pizzas sold in July is 80 less than number of burgers sold in May. Number of pizza sold in April and number of burger sold in July is in ratio of 3:2 respectively. Number of pizzas sold in June is 200 more than burger in same month and number of pizzas sold in month of May is 33.333% less than burger in thesame month. Total products sold in April is 50% more than that sold in July.
6) Find the total number of Burger sold in all the months.
A.1820
B.1720
C.1620
D.1520
E.None of these
7) Find ratio of Pizza sold in April to Burger sold in May respectively.
A.4:3
B.2:3
C.3:4
D.5:6
E.None of these
8) Total number of Burgers sold in month of June is how much percentage of total number of Pizzas sold in July.
A.80%
B.125%
C.120%
D.75%
E.None of these
9) Total number of Burgers sold in July is how much percentage more or less than the total number of Pizzas sold in May.
A.33.333%
B.20%
C.15%
D.50%
E.None of these
10) Find the difference between total number of burgers and pizza sold in all months together.
A.60
B.80
C.120
D.40
E.20
Answers :
Directions (1-5) :
Total number of peoples = 4000
Number of peoples live in Green flat = 1100
Number of peoples live in Red, Blue and Pink flat = 4000 – 1100 = 2900
The ratio of the number of people who live Red and Bluecolour flat in the ratio of 2:3 and the ratio of the number of people live Blue to Pink colour flat is 4:3.
Ratio of the number of peoples live in Red, Blue and Pink flat = 8:12:9
Number of peoples live in Red flat = 8/29 * 2900 = 800
Number of peoples live in Blue flat = 12/29 * 2900 = 1200
Number of peoples live in Pink flat = 9/29 * 2900 = 900
Number of males live in Red flat = 55/100 * 800 = 440
Number of females live in Red flat = 45/100 * 800 = 360
Number of males live in Pink flat = 4/9 * 900 = 400
Number of females live in Pink flat = 5/9 * 900 = 500
Number of males live in Blue flat = 3/2 * 400 = 600
Number of females live in Blue flat = 1200 – 600 = 600
Number of males live in Green flat = 120/100 * 500 = 600
Number of females live in Green flat = 1100 – 600 = 500
1) Answer: A
Required Difference = 500 – 440 = 60
2) Answer: E
Required sum = (360 + 600 + 500 + 500) = 1960
3) Answer: C
Number of males who live in pink flat = 400
Number of peoples who live in Blue flat = 1200
Required percentage = 400/1200 * 100 = 33%
4) Answer: B
Required percentage = (440 + 600 + 600 + 400)/4000 * 100 = 51%
5) Answer: E
Required ratio = 360:600 = 3:5
Directions (6-10) :
Total products sold in June = 1200
Number of pizzas sold in June is 200 more than Burger
Burger + burger + 200 = 1200
Burgers in June = 500
Pizzas in June = 700
Total products in April = 4/5 x 1200 = 960
Burgers in April = 5/8 x 960 = 600
Pizzas in April = 3/8 x 960 = 360
Ratio of pizza in April to burger in July is 3:2
So, burgers in July = 2/3 x 360 = 240
Total products sold in April is 50% more than sold in July
Total products sold in July = 2/3 x 960 = 640
Pizzas in July = 640 –240 = 400
Pizzas sold in July is 80 less than burger in May
Burgers in May = 400 + 80 = 480
Pizzas sold in May is 33.333% less than burger
Pizzas sold in May = 480 – 1/3 x 480 = 320
6) Answer: A
Total number of burgers sold in all months=600+480+500+240 = 1820
7) Answer: C
Required ratio = 360: 480 = 3: 4
8) Answer: B
Required percentage = (500/400) x 100 = 125%
9) Answer: E
Required percentage change = ((320 – 240) / 320) X 100 = 25%
10) Answer: D
Required difference = 1820 – 1780 = 40
Download Caselet Questions for SBI/ IBPS PO Prelims Exam 2021 PDF
Try IBPS PO Free Online Mock Test
Try SBI PO Free Online Mock Test


Aptitude Test