Data Interpretation Test Practice – Day 66 | Data Interpretation Questions:
Dear Readers, Important Practice Data Interpretation Questions for IBPS Exams 2017 was given here with Solutions. Aspirants those who are preparing for the Bank Examination and other Competitive Examination can use this material.
Click Here for More Practice Data Interpretation Questions
[WpProQuiz 850]
Click “Start Quiz” to attend these Questions and view Solutions
Directions (Q. 1-5): Study the following graph carefully to answer these questions
Number of students (Males & Females) selected in IBPS examination in different years
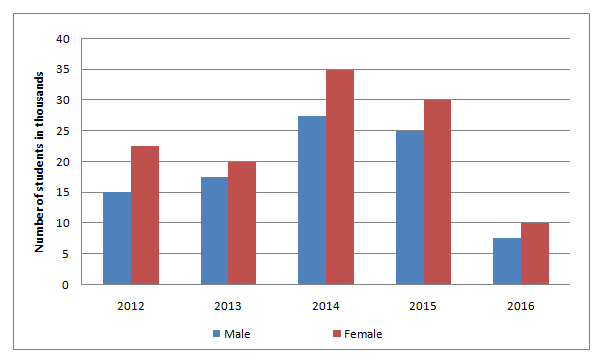
- What is the respective ratio of the total number of Males to the total number of Females selected in all the years together?
- 37:47
- 18:25
- 23:19
- 25:18
- None of these
- The number of Males selected in the year 2012 and 2013 together is what percent of the number of females selected in the year 2014 and 2015 together?
- 45
- 40
- 35
- 50
- None of these
- What is the difference between the total number of students selected in the year 2012 and the total number of students selected in the year 2016?
- 20500
- 21000
- 10500
- 10000
- None of these
- What is the average number of students (Males & Females) selected in all the years together?
- 38000
- 48000
- 42000
- 51000
- None of these
- The number of Females selected in 2014 is approximately what percent the total number of Females selected in all the years together?
- 28
- 30
- 36
- 25
- 40
Directions (Q. 6-10): Study the following table carefully to answer these questions.
Number of students Produced and Sale in an examination from five different exams over the years
| Companies | Ford | Fiat | Honda | Toyota | Skoda | |||||
| Year | Pro | Sale | Pro | Sale | Pro | Sale | Pro | Sale | Pro | Sale |
| 2011 | 600 | 350 | 450 | 250 | 520 | 350 | 580 | 460 | 620 | 500 |
| 2012 | 580 | 250 | 480 | 300 | 550 | 420 | 600 | 480 | 650 | 550 |
| 2013 | 640 | 300 | 420 | 280 | 500 | 400 | 560 | 420 | 580 | 500 |
| 2014 | 650 | 400 | 460 | 320 | 560 | 450 | 620 | 450 | 660 | 550 |
| 2015 | 680 | 450 | 500 | 380 | 580 | 480 | 640 | 520 | 680 | 580 |
- What was the overall percentage of cars Sale over the number of cars Produced from all the companies together in the year 2014? (Rounded off to next integer)
- 74
- 73
- 76
- 72
- None of these
- During year 2013, which company had the highest percentage of cars Sale over Produced?
- Honda
- Fiat
- Ford
- Toyota
- Skoda
- What is the ratio between average number of cars Sale from Fiat and Honda respectively for all the given years?
- 70:51
- 70:53
- 51:70
- 53:70
- None of these
- For Toyota, which year had the lowest percentage of cars Sale over Produced?
- 2011
- 2012
- 2013
- 2014
- 2015
- What is the ratio between the total numbers of cars Produced from all the companies together in the year 2011 and 2012 respectively?
- 286 :295
- 277: 286
- 286 : 277
- 295 : 286
- None of these
Click Here for More Practice Data Interpretation Questions


Subscribe
0 Comments