


Data Interpretation Test Practice – Day 68 | Data Interpretation Questions:
Dear Readers, Important Practice Data Interpretation Questions for IBPS Exams 2017 was given here with Solutions. Aspirants those who are preparing for the Bank Examination and other Competitive Examination can use this material.
Click Here for More Practice Data Interpretation Questions
[WpProQuiz 873]
Click “Start Quiz” to attend these Questions and view Solutions
Direction (Q. 1-5): Study the table carefully and answer the questions that follow.
Number of new accounts opened in six different banks in six different years
| Banks | Years | |||||
| 2011 | 2012 | 2013 | 2014 | 2015 | 2016 | |
| UCO Bank | 29000 | 35500 | 30300 | 29100 | 42000 | 20900 |
| Syndicate Bank | 32300 | 33400 | 37800 | 22400 | 30300 | 41800 |
| Canara Bank | 25500 | 38400 | 43700 | 18800 | 28300 | 40600 |
| Dena Bank | 35300 | 44200 | 42000 | 26600 | 31200 | 35900 |
| Allahabad Bank | 38800 | 41100 | 38600 | 23900 | 24400 | 23300 |
| Indian Bank | 26600 | 39600 | 47200 | 15400 | 38900 | 28500 |
- What is the difference between the average numbers of new account opened by Syndicate Bank and Indian Bank for all the years together?
- 200
- 250
- 300
- 350
- 270
- What is the respective ratio of number of new account opened by Indian Bank, UCO Bank & Syndicate Bank in 2014 to that number of new account opened by Canara Bank, Dena Bank & Allahabad Bank in the same year?
- 223:231
- 225:237
- 231:223
- 233:225
- 213:220
- Number of new account opened in 2015 by Allahabad Bank is approximately what per cent of number of new account opened by Dena Bank in the same year?
- 73
- 78
- 82
- 90
- 66
- Which Bank has opened the lowest number of new accounts in all the years together?
- Indian Bank
- Canara Bank
- Allahabad Bank
- UCO Bank
- None of these
- Which year had the maximum number new account opened from all Banks together?
- 2011
- 2012
- 2015
- 2016
- 2013
Directions (Q. 6-10): In the following column graph, the percentage profit earned by two companies Amazon and Flipkart during the period 2011 to 2016 is given.
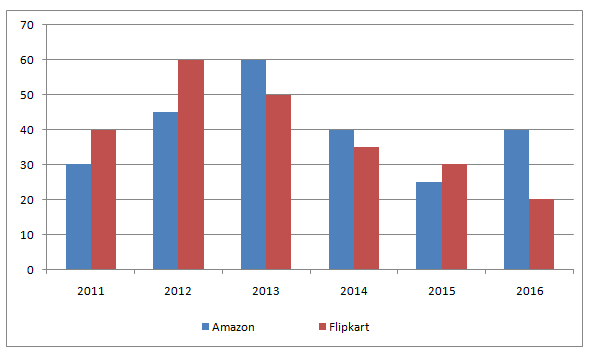
- If the income of Amazon in the year 2016 and the expenditure of Flipkart in the year 2011 are 98 lakh and 85 lakh respectively, what is the sum of the expenditure of Amazon in 2016 and the income of Flipkart in the year 2011?
- 189 lakh
- 195 lakh
- 180 lakh
- 175 lakh
- 199 lakh
- The expenditure of Flipkart in the year 2012 is what percentage of its income in that year?
- 81.5%
- 37.5%
- 62.5%
- 58.5%
- 73.5%
- If the income of Amazon in 2015 and the expenditure of Flipkart in 2016 are equal and that are 90 lakh each, what is the difference between the income of Flipkart in 2016 and the expenditure of Amazon in 2015?
- 38 lakh
- 36 lakh
- 40 lakh
- 30 lakh
- 46 lakh
- What is the percentage increase in the percent profit of Amazon from the year 2012 to 2013?
- 16 2/3%
- 66 1/3%
- 40 2/3%
- 33 1/3 %
- 30 1/3%
- If the incomes of Amazon and Flipkart are equal in the year 2013, what is the ratio of the expenditure of Amazon to that of Flipkart?
- 12 : 17
- 10 : 13
- 17 : 19
- 14 : 15
- 15 : 16
Click Here for More Practice Data Interpretation Questions

thanks