


Data Interpretation Test Practice – Day 69 | Data Interpretation Questions:
Dear Readers, Important Practice Data Interpretation Questions for IBPS Exams 2017 was given here with Solutions. Aspirants those who are preparing for the Bank Examination and other Competitive Examination can use this material.
Click Here for More Practice Data Interpretation Questions
[WpProQuiz 894]
Click “Start Quiz” to attend these Questions and view Solutions
Directions (Q. 1-5): The following pie-charts show the percentage distribution of the total number of users of apple i phone in the year 2015 and 2016, among six different countries.
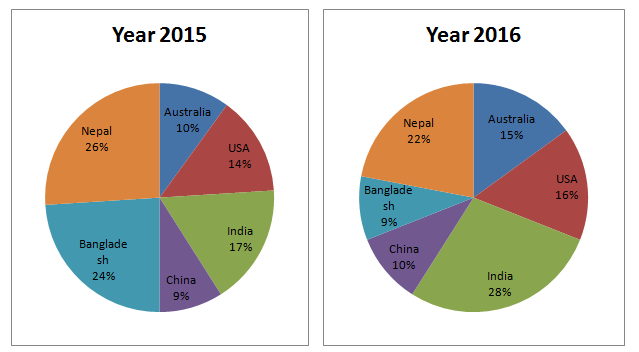
- The percentage share of users from Australia in the year 2016 is approximately what per cent of the percentage share of users from Bangladesh in the year 2015?
- 50.5%
- 57.5%
- 67.5%
- 62.5%
- 72.5%
- If the number of users from India in the year 2015 and that from Bangladesh in the year 2016 were 73100 and 51300 respectively, then what is the total number of users from USA in the year 2015 and 2016 together?
- 1.786 lakh
- 1.321 lakh
- 1.514 lakh
- 1.487 lakh
- 1.602 lakh
- If the number of users from China in the year 2015 and 2016 were 38700 and 57000 respectively, what is the difference between the total number of users from Nepal in the year 2016 and that in 2015?
- 11600
- 13600
- 12800
- 17500
- 15900
- If the ratio of the number of users from Australia in the year 2015 to that in 2016 was 2 : 5, what will be the ratio of the total number of users from all six countries together in year 2015 to that in 2016?
- 5 : 3
- 5 : 9
- 9 : 7
- 4 : 27
- 3 : 5
- If the total number of users from all six countries together in year 2015 and 2016 were 4.3 lakh and 5.7 lakh respectively, what is the difference between the total number of users from USA and India together in the year 2015 and 2016?
- 1.175 lakh
- 1.315 lakh
- 1.435 lakh
- 1.595 lakh
- 1.275 lakh
Directions (Q. 6-10): Following line graph shows the number of pens produced by a company, the number of pens sold by it and the price of one pen of different colours.
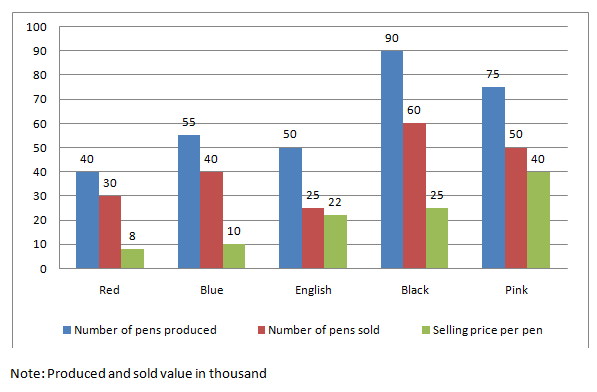
- The profit earned by selling all pens of Blue colour is what percentage of the total profit earned by selling all pens of Pink colour if the per unit cost of Blue pen is 5.5 and that of Pink pen is 25?
- 18%
- 22%
- 24%
- 28%
- 32%
- If the manufacturing cost of English pen and that of Black pens is equal and it is 15 per pen, what is the net profit earned by the company by selling all pens of English and Black colour?
- 6.85 lakh
- 7.05 lakh
- 7.25 lakh
- 7.50 lakh
- 7.75 lakh
- The average number of pens sold by the company is what percentage of the average number of pens produced by it in all the five colours together? (Answer in approximate value)
- 56%
- 62%
- 70%
- 66%
- 75%
- What is the net amount received by the company by selling all the pens of all colours?
- 46.9 lakh
- 47.2 lakh
- 48.8 lakh
- 49.4 lakh
- None of these
- If the cost of manufacturing of Red pen is 4.50 per pen and cost of manufacturing of English pen is 12.50 per pen, what is the net profit earned by the company by selling all pens of Red and English colour together?
- 2.255 lakh
- 3.425 lakh
- 3.235 lakh
- 4.425 lakh
- None of these
Click Here for More Practice Data Interpretation Questions


Subscribe
0 Comments
