


Data Interpretation Test Practice – Day 75 | Data Interpretation Questions:
Dear Readers, Important Practice Data Interpretation Questions for IBPS Exams 2017 was given here with Solutions. Aspirants those who are preparing for the Bank Examination and other Competitive Examination can use this material.
Click Here for More Practice Data Interpretation Questions
[WpProQuiz 1001]Click “Start Quiz” to attend these Questions and view Solutions
Direction (1-5): The bar graphs give the percentage increase in income and expenditure of various telecom companies during a period of 2 years. Refer the graphs and answer the questions that follow.
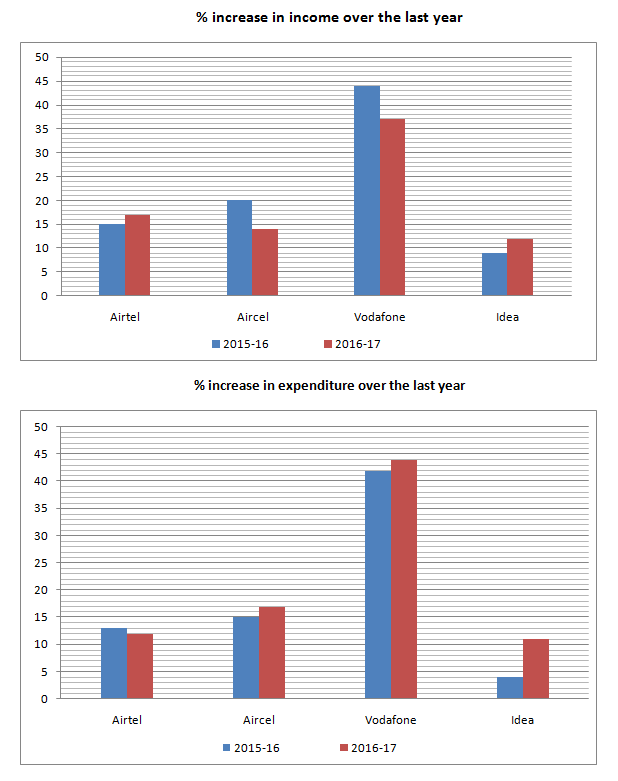
- If the expenditure of Idea in 2014-15 is equal to their income in that year and is equal to Rs 30000 crores. In 2016-17, what is the difference of income and expenditure for Idea(approx)?
- Rs 1500 crores
- Rs 4500 crores
- Rs 3600 crores
- Rs 1000 crores
- Rs 2000 crores
- Let the income of Vodafone in 2015-16 be Rs 4000 crores. If the expenditure of Vodafone in 2015-16 is the same as their income then the difference of incomes of Vodafone in 2015-16 and 2016-17 will be what per cent of the difference of expenditures of Vodafone in 2015-16 and 2016-17?
- 96%
- 80%
- 84%
- 90%
- 100%
- In 2015-16, if the income of Idea is four times their expenditure, then what will be the ratio of the income to the expenditure of the Idea in 2016-17? (Approximately)
- 111 : 448
- 448 : 111
- 382 : 111
- 111 : 382
- 382 : 97
- Let the income of the Airtel in 2014-15 be equal to Rs 500000 crores. If the expenditure of Airtel in 2016-17 is equal to the income of Airtel in 2014-15, then the income of Airtel in 2016-17 will be what per cent more than the expenditure of these companies in 2015-16(approx)?
- 52%
- 74%
- 66%
- 64%
- 60%
- In 2015-16, if the income of Airtel is twice the expenditure of Idea then what will be the ratio of the income of Airtel to the expenditure of Idea in 2016-17?
- 234 : 111
- 101 : 234
- 198 : 173
- 234 : 101
- 230 : 179
Directions (Q. 6-10): Study the following tables carefully and answer the questions given below:
Number of votes registered & Percentage of invalid votes in an election:
Number of votes registered in an election from five states over the Years
| Year | State | ||||
| Assam | Gujarat | Maharashtra | Kerala | Rajasthan | |
| 2010 | 51124 | 37346 | 34145 | 65139 | 45192 |
| 2011 | 50248 | 48932 | 17264 | 58248 | 52314 |
| 2012 | 52368 | 51406 | 24800 | 63309 | 56469 |
| 2013 | 54196 | 42315 | 28315 | 70316 | 71253 |
| 2014 | 58360 | 55492 | 36503 | 69294 | 69632 |
| 2015 | 48230 | 57365 | 29129 | 59216 | 64178 |
| 2016 | 49178 | 58492 | 32438 | 61345 | 56304 |
Approximate Percentages of invalid votes registered in an election
| Year | State | ||||
| Assam | Gujarat | Maharashtra | Kerala | Rajasthan | |
| 2010 | 17 | 9 | 12 | 24 | 18 |
| 2011 | 21 | 12 | 10 | 28 | 12 |
| 2012 | 25 | 10 | 15 | 21 | 23 |
| 2013 | 24 | 8 | 11 | 27 | 19 |
| 2014 | 23 | 13 | 13 | 23 | 16 |
| 2015 | 19 | 11 | 14 | 20 | 21 |
| 2016 | 20 | 14 | 16 | 19 | 24 |
- Approximately what was the difference between the number of invalid votes from Assam in the year 2010 and 2011?
- 1740
- 2040
- 1660
- 2160
- 1860
- Approximately what was the total number of invalid votes from Kerala in 2011 and 2015 together?
- 30750
- 27450
- 29350
- 28150
- 25550
- Approximately how many invalid votes from Rajasthan in 2015 and Assam in 2014 together registered in election?
- 25200
- 26900
- 27500
- 24300
- 28100
- Approximately what was the difference between the number of invalid votes from Maharashtra in 2010 and number of invalid votes from Rajasthan in 2013?
- 8450
- 9320
- 9450
- 9850
- 9710
- In which of the following years, the number of invalid votes from Gujarat was maximum, among the given years?
- 2016
- 2015
- 2014
- 2012
- None of these
Click Here for More Practice Data Interpretation Questions


Leave a Reply