


Data Interpretation Test Practice – Day 76 | Data Interpretation Questions:
Dear Readers, Important Practice Data Interpretation Questions for IBPS Exams 2017 was given here with Solutions. Aspirants those who are preparing for the Bank Examination and other Competitive Examination can use this material.
Click Here for More Practice Data Interpretation Questions
[WpProQuiz 1007]
Click “Start Quiz” to attend these Questions and view Solutions
Directions (Q. 1-5): Study the following pie-chart and table carefully and answer the questions given below
Percentage wise distribution of the number of case registered by court during six years
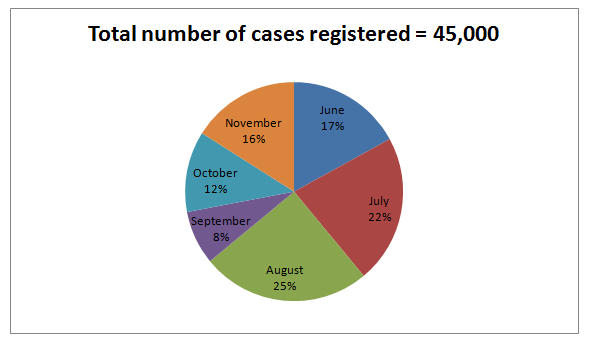
The respective ratio between the numbers of cases registered in Civil cases and Criminal cases during six months
| Months | Ratio |
| June | 8 : 7 |
| July | 4 : 5 |
| August | 3 : 2 |
| September | 7 : 5 |
| October | 7 : 8 |
| November | 7 : 9 |
- If the court charged a fee of 456 on each case registered in Criminal cases during September, what were the total fees collected on the Criminal cases during the same month?
- 694900
- 644800
- 648400
- 684000
- 670500
- If 35% of the case registered in Civil cases during October were not have proper witness, how many cases registered in Civil cases during that month were have proper witness?
- 1028
- 1638
- 1728
- 1362
- 1475
- The number of case registered in Civil cases during June is approximately what percent of the number of case registered in Civil cases during November?
- 120
- 135
- 144
- 125
- 130
- What is the respective ratio of the number of case registered in Criminal cases during June to those case registered during November of the same case?
- 119 : 178
- 135 : 136
- 136 : 135
- 119 : 120
- 135 : 119
- What is the total number of case registered in Criminal cases during July and August together?
- 10,000
- 20,000
- 15,500
- 25,500
- 12, 000
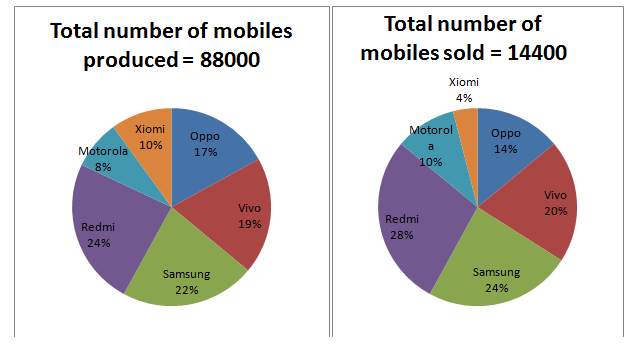
Directions (Q. 6-10): In the following pie-charts, the percentage wise distribution of mobiles produced by different companies and another chart shows percentage of mobiles sold by different companies Read the following pie-charts to answer the questions.
- What percent of mobiles sold in Redmi out of the total mobiles produced in the same?
- 13
- 14
- 22
- 19
- 15
- Find the average number of mobiles sold in Redmi, Samsung and Oppo.
- 3298
- 3618
- 3368
- 3578
- 3168
- What is the ratio between the number of mobiles sold in Oppo and Vivo together and the number of mobiles sold in Redmi and Samsung?
- 26 : 17
- 17 : 21
- 17 : 26
- 21 : 17
- 25 : 27
- What is the difference between the total number of mobiles sold in in Samsung and the number of mobiles produced in the same?
- 15904
- 16904
- 14854
- 17904
- 18904
- What is the sum of the total number of mobiles produced in Oppo and the number of mobiles sold in Motorola and Redmi both?
- 21562
- 20432
- 20234
- 18752
- 20256
Click Here for More Practice Data Interpretation Questions


