


Line Graph Data Interpretation Questions PDF For Bank Exams: Dear Aspirants, Our IBPS Guide team is providing a new series of Quants Questions for SBI Clerk/ IBPS Clerk/ Prelims so the aspirants can practice it on a daily basis. These questions are framed by our skilled experts after understanding your needs thoroughly. Aspirants can practice these new series of Line Graph questions daily to familiarize themselves with the exact exam pattern and make their preparation effective. The Line Graph DI Questions PDF is attached here for the bank exam preparation. Aspirants who are effectively preparing for the bank PO and clerk exam shall utilize this Line Graph DI Questions PDF to enhance their preparation level. As we all know the quantitative aptitude section is the most important section of all the bank exams. In the aptitude section, Line Graph DI Questions play a major role. It helps us to maximize our marks in the aptitude section of the bank exams. So every aspirant should be proficient with the Line Graph DI questions which are frequently asked in most of the bank PO and Clerk examinations. We have added the Line Graph DI Questions PDF to this article. Candidates shall download this Line Graph DI Questions PDF and prepare well for the upcoming bank exams. The questions in this Line Graph DI Questions PDF for bank exams are curated by our experts by analyzing the current trend and previous year’s bank exam question papers. Candidates are advised to kindly download our Line Graph DI PDF for bank PO, Clerk Prelims, and Mains and enhance their knowledge as well.
Line Graph DI Questions PDF For Bank Exams
The Line Graph DI Questions PDF For Bank Exams link is provided below. Candidates can download the Line Graph DI Questions PDF by clicking the link. The prelims and mains exams of most of the bank exams contain the Line Graph DI questions as it is an important topic. We can easily score 5 marks in the Line Graph DI topic if we practice with the Line Graph DI Questions PDF for bank exams. So download this Line Graph DI Questions PDF for bank exams as soon as possible to prepare effectively for your upcoming bank examinations.
Download Line Graph DI Questions PDF
Also, we will update the Line Graph DI questions pdf and Line Graph DI quiz daily in the below table. Candidates can download this Line Graph DI questions pdf to practice regularly. You can attempt the daily Line Graph DI test by clicking the take test link provided in the following table.
| Line Graph DI Questions For Bank Exams – Daily Quiiz | ||
| Day 1 | Line Graph DI Questions PDF | Take Test |
| Day 2 | Line Graph DI Questions PDF | Take Test |
Line Graph DI Questions And Answers
The Line Graph DI PDF Questions PDF contains all the levels and types of Line Graph DI questions with answers and detailed explanations. Utilize this Line Graph DI questions and answers pdf for the bank Prelims exam and Line Graph DI questions and answers pdf for bank mains to improve your speed and accuracy while solving the Line Graph DI questions in real exams. You may experience all the techniques and tricks to solve the questions while practicing with the Line Graph DI questions and answers pdf for bank exams. Aspirants who have quant as their weak section must take up this PDF for bank exams and practice with this regularly. Candidates can start their effective preparation by exploiting this Line Graph DI questions pdf for bank exams.
More Quantitative Aptitude Topics Free PDF
Start Quiz
Directions (01-05): Study the following information carefully and answer the questions given below.
The given line graph shows the number of students qualified in two different schools in five different years.
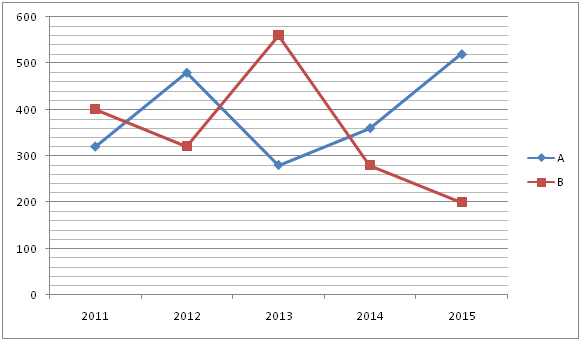
1) If the number of boys to girls qualified in A in 2011 and 2013 is 5:3 and 4:3 respectively, then find the difference between the number of boys qualified in A in 2011 and 2013?
A.40
B.30
C.50
D.60
E.None of these
2) What is the ratio of the total number of students qualified in 2015 in both schools to the total number of students qualified in 2012 and 2013 together in B?
A.5:7
B.7:10
C.9:11
D.8:11
E.5:11
3) Find the average number of students qualified in B in all the given years together?
A.348
B.352
C.350
D.346
E.344
4) If the number of students qualified in 2015 in C is the average number of students qualified in 2015 in A and B and the number of boys qualified in C in 2015 is 136, then find the number of girls qualified in C in 2015?
A.222
B.224
C.226
D.220
E.218
5) The number of students qualified in 2014 in A is what percent of the number of students qualified in 2012 in the same school?
A.55%
B.65%
C.70%
D.75%
E.80%
Directions (06-10): Study the following information carefully and answer the questions given below.
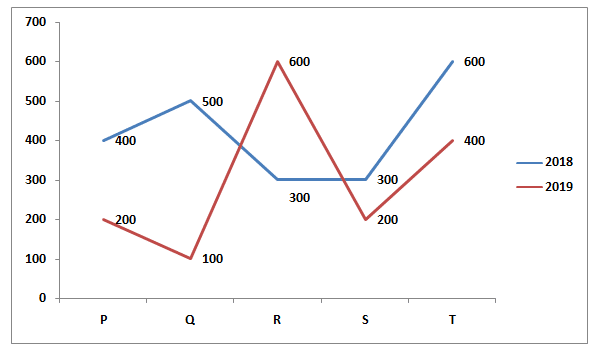
The given bar graph shows the number of employees working in five different companies in India in two different years
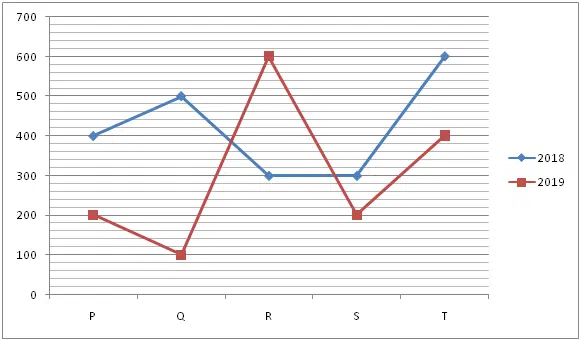
6) The number of employees working in company R in 2018 is what percent of the number of employees working in company P in the same year?
A.55%
B.65%
C.75%
D.85%
E.None of these
7) What is the respective ratio of the number of employees working in company Q and S together in 2018 to the number of employees working in company R and T together in 2019?
A.2: 3
B.3: 4
C.4: 5
D.5: 6
E.None of these
8) The number of employees working in the company R in 2019 is what percent of the number of employees working in company S in 2019?
A.100%
B.300%
C.150%
D.250%
E.None of these
9) Find the average number of employees working in all the companies together in 2018.
A.420
B.380
C.290
D.210
E.None of these
10) Find the ratio of the number of employees working in T in 2018 to the number of employees working in Q in 2019?
A.2: 3
B.3: 1
C.2: 9
D.6: 1
E.None of these
Try Data Interpretation Questions For Online Mock Test
Answers :
1) Answer: A
Number of boys in A in 2011 = 5/8 * 320 = 200
Number of boys in A in 2013 = 4/7 * 280 = 160
Difference = 200 – 160 = 40
2) Answer: C
Required ratio = (520 + 200):(320 + 560)
= 720:880
= 9:11
3) Answer: B
Required average = (400 + 320 + 560 + 280 + 200)/5
= 352
4) Answer: B
Number of students qualified in C in 2015 = (520 + 200)/2 = 360
Number of girls qualified in C in 2015 = 360 – 136 = 224
5) Answer: D
Required % = 360/480 * 100 = 75%
6) Answer: C
Number of employees working in company R in the year 2018 = 300
Number of employees working in company P in the same year = 400
Required % = 300/400 * 100 = 75%
7) Answer: C
Number of employees working in Q and S together in 2018 = 500 + 300 = 800
Number of employees working in R and T together in the year 2019 = 600 + 400
= 1000
Required ratio = 800: 1000 = 4: 5
8) Answer: B
Number of employees working in the company R in the year 2019 = 600
Number of employees working in company S in 2019 = 200
Required % = 600/200 * 100 = 300%
9) Answer: A
Required average = (400 + 500 + 300 + 300 + 600)/5
= 2100/5
= 420
10) Answer: D
Number of employees working in T in the year 2018 = 600
Number of employees working in Q in 2019 = 100
Required Ratio = 600: 100 = 6: 1
Start Quiz
Directions (11-15): Study the following information carefully and answer the questions given below.
The given line graph shows the quantity of Gold, Silver and Bronze (in kg) sold in five different shops namely A, B, C, D and E.
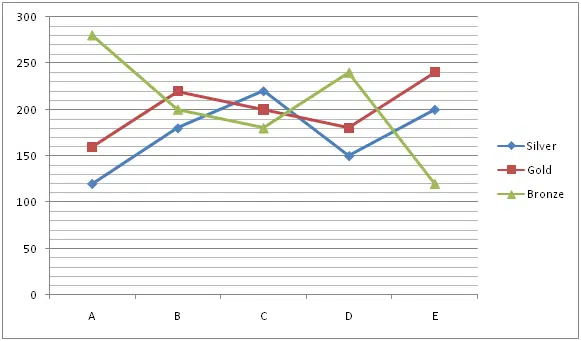
11) The quantity of Gold sold in A is what percent of the quantity of Bronze and Silver together sold in E?
a) 75%
b) 60%
c) 50%
d) 80%
e) 65%
12) Find the average of the quantity of Silver sold in all the shops together?
a) 174 kg
b) 178 kg
c) 180 kg
d) 172 kg
e) 184 kg
13) What is the ratio of the quantity of gold, silver and bronze together sold in C to D?
a) 20:17
b) 20:19
c) 21:19
d) 20:23
e) None of these
14) What is the difference between the quantity of silver and bronze together sold in A and the quantity of silver and gold together sold in B?
a) 120
b) 80
c) 60
d) 40
e) None of these
15) The quantity of bronze sold in B is what percent of the quantity of gold sold in E?
a) 83.33%
b) 87.5%
c) 99.99%
d) 77.77%
e) 88.88%
Directions (16-20): Study the following information carefully and answer the questions given below.
The given line graph shows the total number of goods exported in four different years i.e. 2011, 2012, 2013 and 2014 and also given the number of automobile goods exported in these four years.
Note: Total number of goods exported = Automobile Goods exported + Electronic Goods exported
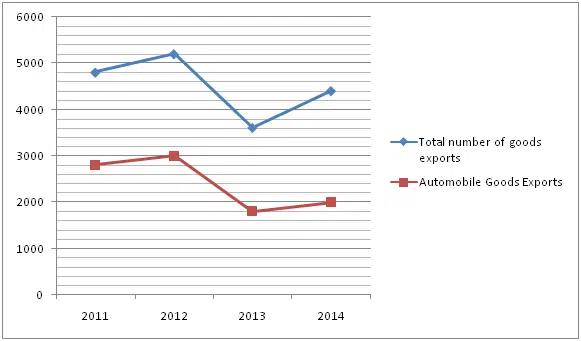
16) The total number of electronic goods exported in 2013 is what percent of the total number of goods exported in 2013?
a) 50%
b) 70%
c) 40%
d) 60%
e) 80%
17) Total number of goods exported in 2012 is what percent more than the total number of goods exported in 2014?
a) 12.12%
b) 14.14%
c) 16.16%
d) 18.18%
e) 20.20%
18) Find the average number of electronic goods exported in all the given years together?
a) 2000
b) 2100
c) 2200
d) 1900
e) 2300
19) What is the ratio of the total number of Automobile goods exported in 2012 and 2014 together to the total number of electronic goods exported in 2011 and 2013 together?
a) 25:19
b) 5:4
c) 25:18
d) 24:19
e) 12:9
20) What is the difference between the total number of goods exported in 2014 and 2011?
a) 500
b) 300
c) 400
d) 200
e) 600
Try Data Interpretation Questions For Online Mock Test
Answers :
11) Answer: C
Required percentage = 160/(200 + 120) * 100
= 50%
12) Answer: A
Required average = (120 + 180 + 220 + 150 + 200)/5
= 174
13) Answer: B
Required ratio = (220 + 200 + 180):(150 + 180 + 240)
= 600:570
=20:19
14) Answer: E
Required difference = (120 + 280) – (180 + 220)
= 0
15) Answer: A
Required percentage = 200/240 * 100
= 83.33%
16) Answer: A
Required percentage = (3600 – 1800)/3600 * 100
= 50%
17) Answer: D
Required percentage = (5200 – 4400)/4400 * 100
= 18.18%
18) Answer: B
Number of electronic goods exported in 2011 = 4800 – 2800 = 2000
Number of electronic goods exported in 2012 = 5200 – 3000 = 2200
Number of electronic goods exported in 2013 = 3600 – 1800 = 1800
Number of electronic goods exported in 2014 = 4400 – 2000 = 2400
Required average = (2000 + 2200 + 1800 + 2400)/4
= 2100
19) Answer: A
Required ratio = (3000 + 2000):(2000 + 1800)
= 5000:3800
= 25:19
20) Answer: C
Required difference = 4800 – 4400 = 400
Start Quiz
Directions (21-25): Study the following information carefully and answer the questions given below.
The given line graph shows the number of satellite launched by six different countries namely India, China, US, Russia, Japan and UK.
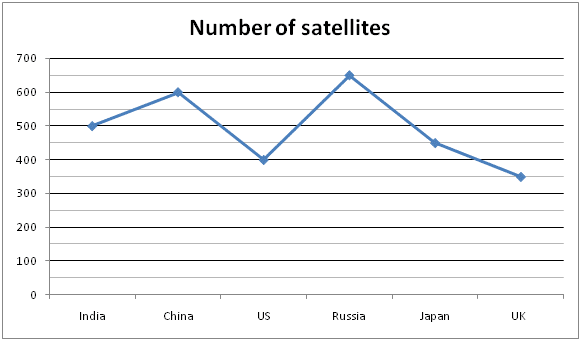
21) The number of satellite launched by US is what percent of the number of satellite launched by Japan?
A.86.67%
B.88.89%
C.90.90%
D.84.45%
E.92.25%
22) What is the ratio of the number of satellites launched by China to UK?
A.12:7
B.13:8
C.11:6
D.10:7
E.11:7
23) What is the average number of satellites launched by India, Russia and UK?
A.480
B.450
C.500
D.520
E.420
24) What is the difference between the number of satellites launched by China and US?
A.150
B.200
C.250
D.300
E.350
25) If the number of satellites launched by Germany is 30% more than the number of satellites launched by Russia and the number of satellites launched by Brazil is 24% more than the number of satellite launched by Japan. What is the difference between the number of satellites launched by Brazil and Germany?
A.287
B.291
C.297
D.283
E.277
Directions (26-30): Study the following information carefully and answer the questions given below.
The given line graph shows the total number of precious stones exported from India in 2018 and 2019 together and also given the number of precious stones exported from India in 2018.
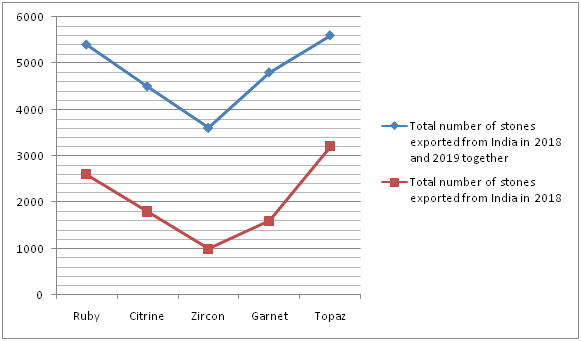
26) The number of Ruby stones exported from India in 2019 is what percent of the total number of Ruby stones exported from India in 2018 and 2019 together?
A.51.85%
B.54.75%
C.58.76%
D.56.90%
E.60.04%
27) What is the ratio of the number of Citrine stones exported from India in 2018 to the number of Zircon stones exported from India in 2019?
A.5:6
B.9:10
C.9:13
D.5:8
E.5:13
28) The number of Garnet stones exported from India in 2019 is what percent more than the number of Topaz stones exported from India in 2019?
A.44.44%
B.66.66%
C.55.55%
D.33.33%
E.22.22%
29) What is the difference between the number of citrine stones exported from India in 2019 and the number of Zircon stones exported from India in 2018?
A.1700
B.1900
C.2000
D.2100
E.1500
30) Find the total number of Ruby, Garnet and topaz stones together exported from India in 2018?
A.7200
B.7400
C.7600
D.7800
E.8000
Try Data Interpretation Questions For Online Mock Test
Answers :
21) Answer: B
Required percentage = 400/450 * 100
= 88.89%
22) Answer: A
Required ratio = 600:350
= 12:7
23) Answer: C
Required average = (500 + 650 + 350)/3=1500/3
= 500
24) Answer: B
Required Difference = 600 – 400 = 200
25) Answer: A
Number of satellites launched by Germany = 130/100 * 650 = 845
Number of satellites launched by Brazil = 124/100 * 450 = 558
Required Difference = 845 – 558 = 287
26) Answer: A
Required percentage = (5400 – 2600)/5400 * 100
= (2800/5400) * 100
= 51.85%
27) Answer: C
Required ratio = 1800:(3600 – 1000)
= 1800 : 2600
= 9:13
28) Answer: D
Required percentage = ((4800 – 1600) – (5600 – 3200))/(5600 – 3200) * 100
= 800/2400 * 100
= 33.33%
29) Answer: A
Required Difference = (4500 – 1800) – 1000
= 1700
30) Answer: B
Required sum = 2600 + 1600 + 3200
= 7400
Start Quiz
Directions (31-35): Study the following information carefully and answer the questions given below.
The given line graph shows the number of girls and boys studying in five different schools namely P, Q, R, S and T.
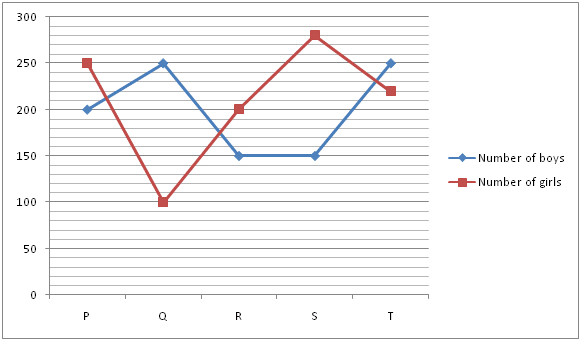
31) Which school has the highest number of students (both girls and boys)?
A.P
B.Q
C.R
D.S
E.T
32) The number of students in school P is how much percentage of the number of students in school S?
A.98.5%
B.104.7%
C.132.8%
D.144.7%
E.158.2%
33) Find the ratio of the total number of boys to girls in the schools P, R and T together.
A.31: 32
B.32: 31
C.60: 67
D.67: 60
E.None of these
34) What percentage will be the number of girls in school R out of the number of girls in school P and Q together?
A.57.14%
B.68.12%
C.72.34%
D.81.92%
E.92.72%
35) What is the highest difference between the number of boys and girls among all the schools?
A.130
B.150
C.140
D.120
E.None of these
Directions (36-40): Study the following information carefully and answer the questions given below.
The given line graph shows the number of Managers, SO, PO, Clerk and Peon working in SBI.
Total number of SO and Peon together working in SBI is 15000 which is 6000 more than the number of peon working in SBI.
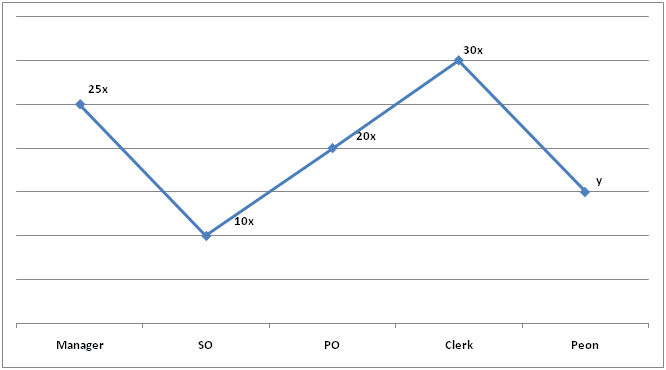
36) What is the ratio of the total number of SO to Peon working in SBI?
A.3:4
B.2:3
C.1:4
D.3:5
E.None of these
37) If the ratio of the number of male to female PO working in SBI is 5:7, then what is the total number of female PO working in SBI?
A.5000
B.6000
C.7000
D.8000
E.None of these
38) What is the average number of Manager, SO and Clerk working in SBI?
A.11000
B.13000
C.15000
D.14000
E.12000
39) If the number of Assistant managers working in SBI is 20% more than the number of Peon working in SBI, then what is the ratio of the number of Assistant Managers to Clerk working in SBI?
A.4:5
B.2:3
C.5:6
D.2:1
E.None of these
40) Total number of Peon working in SBI is what percent more than the number of SO working in SBI?
A.40%
B.45%
C.50%
D.60%
E.55%
Try Data Interpretation Questions For Online Mock Test
Answers :
31) Answer: E
Number of students in P = 200 + 250 = 450
Number of students in Q = 100 + 250 = 350
Number of students in R = 150 + 200 = 350
Number of students in S = 150 + 280 = 430
Number of students in T = 220 + 250 = 470 (Highest)
32) Answer: B
Number of students in P = 200 + 250 = 450
Number of students in S = 150 + 280 = 430
Required % = 450/430 * 100 = 104.7%
33) Answer: C
Boys in the schools P, R and T = 200 + 150 + 250 = 600
Girls in the schools P, R and T = 250 + 200 + 220 = 670
Required ratio = 600: 670 = 60: 67
34) Answer: A
Girls in school R = 200
Girls in P and Q = 250 + 100 = 350
Required % = 200/350 * 100 = 57.14%
35) Answer: B
Difference in P = 250 – 200 = 50
Q = 250 – 100 = 150 (Highest difference)
R = 200 – 150 = 50
S = 280 – 150 = 130
T = 250 – 220 = 30
Directions (36-40) :
Number of peon working in SBI = y
10x + y = 15000
Number of peon working in SBI = 15000 – 6000 = 9000
10x = 15000 – 9000 = 6000
x = 600
Number of Managers working in SBI = 25 * 600 = 15000
Number of SO working in SBI = 6000
Number of PO working in SBI = 20 * 600 = 12000
Number of Clerk working in SBI = 30 * 600 = 18000
36) Answer: B
Required ratio = 6000:9000 = 2:3
37) Answer: C
Number of female PO = 7/12 * 12000 = 7000
38) Answer: B
Required average = (15000 + 6000 + 18000)/3
= 13000
39) Answer: E
Required ratio = 9000 * 120/100:18000
= 3:5
40) Answer: C
Required percentage = (9000 – 6000)/6000 * 100
=3000/6000 * 100
= 50%
Start Quiz
Directions (41-45): Study the following information carefully and answer the questions given below.
The given line chart shows the percentage distribution of the number of students in six different schools.
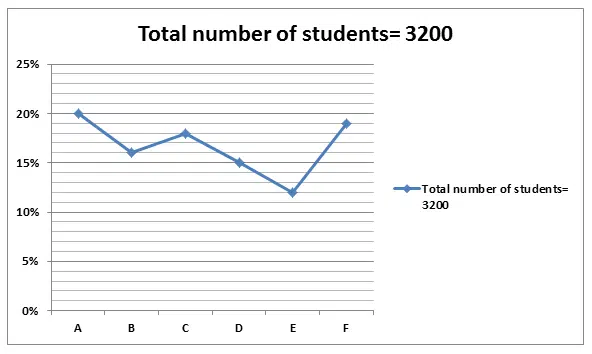
41) If 25% of the number of students in B are Accounts group and rest are Biology group and the ratio of the number of boys and girls in biology and accounts group is 3:5 and 3:1, then find the difference between the number of boys and girls in B?
A.36
B.30
C.34
D.38
E.32
42) If the number of Students in G is 25% more than the number of students in C, then find the sum of the number of students in F and G?
A.1242
B.1248
C.1328
D.1348
E.1352
43) What is the average number of students in A, F and D?
A.476
B.526
C.548
D.484
E.576
44) Ratio of the number of boys to girls in A and F is 3:2 and 3:1 respectively. What is the difference between the number of boys in A and F?
A.68
B.72
C.76
D.64
E.80
45) The number of students in G is equal to the difference between the number of students in D and E and the ratio of the boys to girls in G is 5:3. Find the number of boys in G?
A.50
B.40
C.60
D.56
E.30
Directions (46-50): Read the following information carefully and answer the questions.
The given line graph shows the number of meetings held by four different organization in four years i.e. 2016, 2017, 2018, 2019.
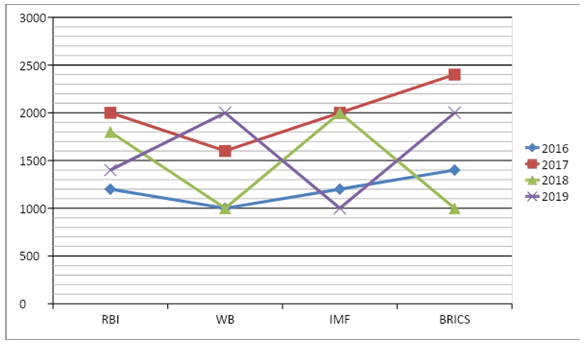
46) The number of meetings held in 2016 in all the organization together is what percent of the number of meetings held in 2017 in all the organization together?
A.40%
B.50%
C.60%
D.70%
E.30%
47) What is the ratio of the number of BRICS meeting held in 2019 and 2017 together to the number of IMF meeting held in 2016 and 2018 together?
A.7:4
B.8:5
C.9:5
D.10:9
E.11:8
48) What is the difference between the total number of WB meeting held in all years together and the number of BRICS meeting held in all the years together?
A.1200
B.1400
C.800
D.1000
E.1500
49) The number of RBI meeting held in 2018 is approximately what percent of the total number of RBI meeting held in all the years together?
A.22%
B.28%
C.30%
D.32%
E.26%
50) What is the difference between the number of meeting held in all the organization together in 2018 and 2019?
A.400
B.600
C.300
D.800
E.500
Try Data Interpretation Questions For Online Mock Test
Answers :
41) Answer: E
Number of students in accounts group = 25/100 * 16/100 * 3200 = 128
Number of students in biology group = 75/100 * 16/100 * 3200 = 384
Number of boys in account group = 128 * 3/4 = 96
Number of girls in account group = 128 * 1/4 = 32
Number of boys in biology group = 384 * 3/8 = 144
Number of girls in biology group = 384 * 5/8 = 240
Difference = (240 + 32) – (144 + 96)
= 32
42) Answer: C
Required sum = 125/100 * 18/100 * 3200 + 19/100 * 3200
= 1328
43) Answer: E
Required average = (20 + 19 + 15)/300 * 3200
= 576
44) Answer: B
Required Difference = (3/4 * 19/100 * 3200) – (3/5 * 20/100 * 3200)
= 456 – 384
= 72
45) Answer: C
The number of students in G = (15 – 12)/100 * 3200
= 96
Number of boys in G = 96 * 5/8 = 60
46) Answer: C
Required percentage = (1200 + 1000 + 1200 + 1400)/(2000 + 1600 + 2000 + 2400) * 100
= (4800/8000) * 100
= 60%
47) Answer: E
Required ratio = (2000 + 2400):(1200 + 2000)
= 4400:3200
= 11:8
48) Answer: A
Required difference = (1400 + 2400 + 1000 + 2000) – (1000 + 1600 + 1000 + 2000)
= 6800 – 5600
= 1200
49) Answer: B
Required percentage = 1800/(1200 + 2000 + 1800 + 1400) * 100
= (1800/6400) * 100
= 28%
50) Answer: B
Required difference = (1400 + 2000 + 1000 + 2000) – (1800 + 1000 + 2000 + 1000)
= 6400 – 5800
= 600
Start Quiz
Direction (51-55): Study the following information carefully and answer the questions given below.
The given line graph shows the number of six different juice sold in three different days.
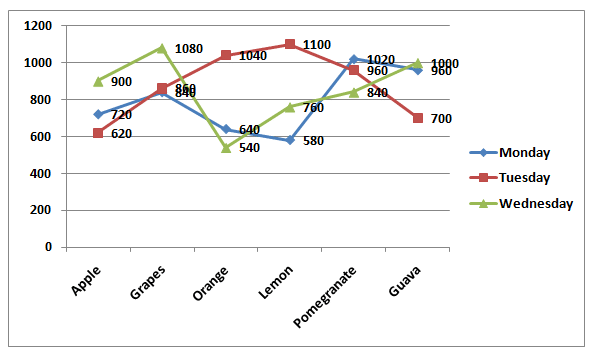
51) What is the average number of juices sold in Tuesday?
A.720
B.780
C.820
D.840
E.880
52) What is the difference between the number of Lemon juices sold in Wednesday and the total number of juices sold in Wednesday?
A.4290
B.4310
C.4340
D.4360
E.4320
53) Which of the given juice is sold most in all the given days together?
A.Apple
B.Pomegranate
C.Grapes
D.Guava
E.Lemon
54) The number of Pomegranate juice sold in Monday is what percent of the total number of juices sold in Monday?
A.19.85%
B.20.19%
C.21.42%
D.23.87%
E.24.25%
55) The number of Grapes juice sold in Wednesday is what percent of the number of Guava juice sold in all the days together?
A.40.6%
B.42.5%
C.44.4%
D.46.7%
E.48.8%
Direction (56-60): Study the following information carefully and answer the questions given below.
The below graph shows the number of employees working in five different companies in India in two different years
56) The number of employees working in company R in the year 2018 is what percent of the number of employees working in company P in the same year?
A.55%
B.65%
C.75%
D.85%
E.None of these
57) What is the respective ratio of the number of employees working in the company Q and S together in the year 2018 to the number of employees working in the company R and T together in the year 2019?
A.2: 3
B.3: 4
C.4: 5
D.5: 6
E.None of these
58) The number of employees working in the company R in the year 2019 is what percent of the number of employees working in company S in 2019?
A.100%
B.300%
C.150%
D.250%
E.None of these
59) Find the average number of employees working in all the companies together in the year 2018.
A.420
B.380
C.290
D.210
E.None of these
60) Find the ratio of the number of employees working in T in the year 2018 to the number of employees working in Q in 2019?
A.2: 3
B.3: 1
C.2: 9
D.6: 1
E.None of these
Try Data Interpretation Questions For Online Mock Test
Answers :
51) Answer: E
Required average = (620 + 860 + 1040 + 1100 + 960 + 700)/6
= 5280/6
= 880
52) Answer: D
Required difference = (900 + 1080 + 540 + 760 + 840 + 1000) – 760
= 5120-760
= 4360
53) Answer: B
Apple = 720 + 620 + 900 = 2240
Grapes = 840 + 860 + 1080 = 2780
Orange = 640 + 1040 + 540 = 2220
Lemon = 580 + 1100 + 760 = 2440
Pomegranate = 1020 + 960 + 840 = 2820
Guava = 960 + 700 + 1000 = 2660
54) Answer: C
Required percentage = 1020/(720 + 840 + 640 + 580 + 1020 + 960) * 100
= (1020/4760) * 100
= 21.42%
55) Answer: A
Required percentage= 1080/(960 + 700 + 1000) * 100
= (1080/2660) * 100
= 40.6%
56) Answer: C
Number of employees working in company R in the year 2018 = 300
Number of employees working in company P in the same year = 400
Required % = 300/400 * 100 = 75%
57) Answer: C
Number of employees working in Q and S together in 2018 = 500 + 300 = 800
Number of employees working in R and T together in the year 2019 = 600 + 400
= 1000
Required ratio = 800: 1000 = 4: 5
58) Answer: B
Number of employees working in the company R in the year 2019 = 600
Number of employees working in company S in 2019 = 200
Required % = 600/200 * 100 = 300%
59) Answer: A
Required average = (400 + 500 + 300 + 300 + 600)/5
= 2100/5
= 420
60) Answer: D
Number of employees working in T in the year 2018 = 600
Number of employees working in Q in 2019 = 100
Required Ratio = 600: 100 = 6: 1
Download Line Graph Questions for IBPS Clerk Prelims Exam PDF
For More Line Graph Questions PDF
Try IBPS Clerk Free Online Mock Test
Try SBI Clerk Free Online Mock Test


Aptitude questions and answers for student to practice previous year exams, interview, competitive examination and entrance exams