


The aspirants can check the details of the Line graph for Bank PO Prelims Exam. It is an important topic in quantitative aptitude. A line graph is a type of chart used to show information that changes over time. A line graph shows how values change. For example, you could plot how your child grows over time. Line graphs For Bank PO Prelims can also be used to show how functions change. … Line graphs have a horizontal axis (the x-axis) and a vertical axis (the y-axis). In most cases, time is plotted on the horizontal axis. Line graphs, also called line charts, are used to represent quantitative data collected over a specific subject and a specific time interval. All the data points are connected by a line. Data points represent the observations that are collected on a survey or research. The line graph For Bank PO Prelims has an x-axis and a y-axis. Line graph has a horizontal axis called the x-axis and a vertical axis called the y-axis. The x-axis usually has a time period over which we would like to measure the quantity of a specific thing or an item in the y-axis. Line graph helps to analyze the trend of whether the quantity in the y-axis is increasing or decreasing over a period of time. Line graph gives a clear picture of an increasing or a decreasing trend.
The world today is becoming more and more information-oriented. Every part of our lives utilizes data in one form or another. The tabular representation of data is an ideal way of presenting them systematically. When these numerical figures are represented graphically in the form of a bar graph or a line graph, they become more noticeable and easily understandable, leaving a long-lasting effect on the mind of the observer. Start practicing for the Line Graph For Bank PO Prelims exam.
Line Graph For Bank PO Prelims Exam (FAQ):
1) Where do we use a line graph in real-life?
Ans. Line graphs are used to track changes over short and long periods. Line graphs are useful to study or represent temperature, rainfall, the revenue of a company, etc.
2) What are the Parts of a Line Graph?
Ans. The parts of a line graph include Title, Labels, Scales, Points, and, Lines.
Start Quiz
Directions (01-05): Study the following information carefully and answer the questions given below.
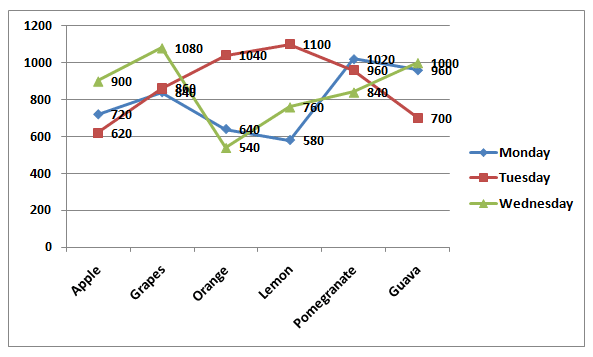
The given line graph shows the number of six different juice sold in three different days.
1) What is the average number of juices sold in Tuesday?
A.720
B.780
C.820
D.840
E.880
2) What is the difference between the number of Lemon juices sold in Wednesday and the total number of juices sold in Wednesday?
A.4290
B.4310
C.4340
D.4360
E.4320
3) Which of the given juice is sold most in all the given days together?
A.Apple
B.Pomegranate
C.Grapes
D.Guava
E.Lemon
4) The number of Pomegranate juice sold in Monday is what percent of the total number of juices sold in Monday?
A.19.85%
B.20.19%
C.21.42%
D.23.87%
E.24.25%
5) The number of Grapes juice sold in Wednesday is what percent of the number of Guava juice sold in all the days together?
A.40.6%
B.42.5%
C.44.4%
D.46.7%
E.48.8%
Directions (06-10): Study the following information carefully and answer the questions given below.
The given bar graph shows the percentage of buildings constructed and the number of buildings demolished in five different cities.
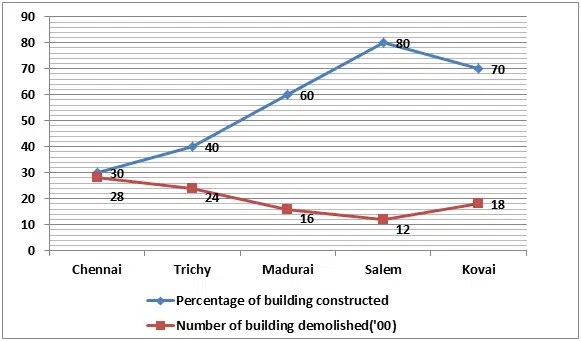
Total number of buildings = number of buildings constructed + number of buildings demolished
6) The number of buildings constructed in Madurai is what percent of the number of buildings constructed in Kovai?
A.51.14%
B.55.14%
C.57.14%
D.53.14%
E.59.14%
7) What is the difference between the total number of buildings constructed and demolished in Trichy and Chennai together?
A.1
B.8
C.5
D.10
E.None of these
8) What is the average number of buildings constructed in Salem, Kovai and Chennai together?
A.3300
B.3500
C.3700
D.3600
E.3400
9) If 45% of the total number of buildings from Trichy are government oriented, then find the total number of buildings in Trichy are non government oriented?
A.2200
B.2100
C.2300
D.2400
E.2000
10) The number of buildings constructed in Madurai is what percent of the total number of buildings constructed and demolished in Salem?
A.30%
B.40%
C.35%
D.25%
E.20%
Try Data Interpretation Questions For Online Mock Test
Answers :
1) Answer: E
Required average = (620 + 860 + 1040 + 1100 + 960 + 700)/6
= 5280/6
= 880
2) Answer: D
Required difference = (900 + 1080 + 540 + 760 + 840 + 1000) – 760
= 5120-760
= 4360
3) Answer: B
Apple = 720 + 620 + 900 = 2240
Grapes = 840 + 860 + 1080 = 2780
Orange = 640 + 1040 + 540 = 2220
Lemon = 580 + 1100 + 760 = 2440
Pomegranate = 1020 + 960 + 840 = 2820
Guava = 960 + 700 + 1000 = 2660
4) Answer: C
Required percentage = 1020/(720 + 840 + 640 + 580 + 1020 + 960) * 100
= (1020/4760) * 100
= 21.42%
5) Answer: A
Required percentage= 1080/(960 + 700 + 1000) * 100
= (1080/2660) * 100
= 40.6%
6) Answer: C
Number of buildings constructed in Madurai = 60/40 * 1600 = 2400
Number of buildings constructed in Kovai = 70/30 * 1800 = 4200
Required percentage = 2400/4200 * 100 = 57.14%
7) Answer: E
Total number of buildings in Trichy = 100/60 * 2400 = 4000
Total number of buildings in Chennai = 100/70 * 2800 = 4000
Difference = 4000 – 4000 = 0
8) Answer: E
Number of buildings constructed in Salem = 80/20 * 1200 = 4800
Number of buildings constructed in Kovai = 70/30 * 1800 = 4200
Number of buildings constructed in Chennai = 30/70 * 2800 = 1200
Required average = (4800 + 4200 + 1200)/3
= 3400
9) Answer: A
Total number of buildings in Trichy = 100/60 * 2400 = 4000
Number of buildings are non government = 4000 * (100 – 45)/100 = 2200
10) Answer: B
Number of buildings constructed in Madurai = 60/40 * 1600 = 2400
Total number of buildings in Salem = 4800 + 1200 = 6000
Required percentage = 2400/6000 * 100 = 40%
Start Quiz
Directions (11-15): Study the following information carefully and answer the questions given below.
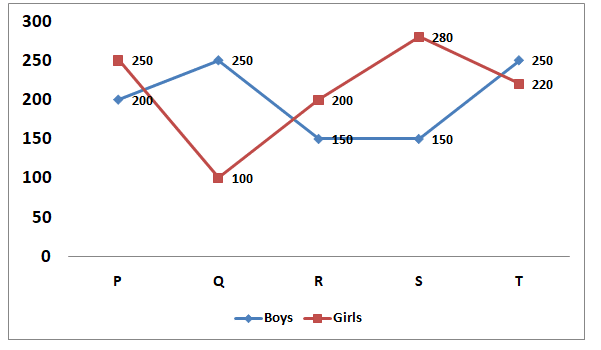
The given line graph shows the number of girls and boys studying in five different schools
11) What is the highest difference between the boys and girls among all the schools?
A.130
B.150
C.140
D.120
E.None of these
12) What percentage will be the number of girls in school R out of the number of girls in school P and Q together?
A.57.14%
B.68.12%
C.72.34%
D.81.92%
E.92.72%
13) Find the ratio of the number of boys to girls in the schools P, R and T together.
A.31: 32
B.32: 31
C.60: 67
D.67: 60
E.None of these
14) The number of students in school P is how much percentage of the number of students in school S?
A.98.5%
B.104.7%
C.132.8%
D.144.7%
E.158.2%
15) Which of the school has the highest number of students (both girls and boys)?
A.P
B.Q
C.R
D.S
E.T
Directions (16-20): Study the following information carefully and answer the questions given below.
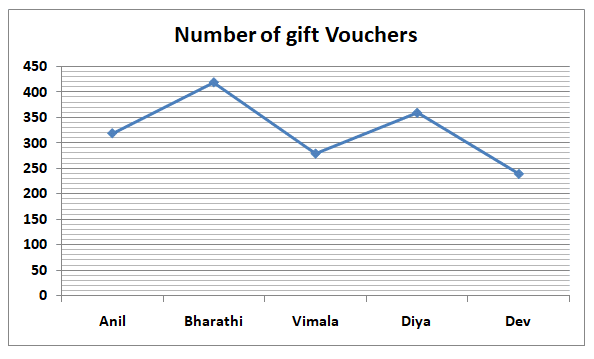
The given line graph shows the five different persons has the number of gift vouchers.
16) What is the difference between the average numbers of gift vouchers has Bharathi and Vimala and the average number of gift vouchers has Diya and Dev?
A.30
B.40
C.50
D.60
E.70
17) If the number of gift vouchers has Hari is 25% more than the number of gift vouchers has Vimala, then what is the difference between the numbers of gift vouchers has Hari and Anil?
A.20
B.30
C.40
D.50
E.10
18) What is the average number of gift vouchers has all the persons together?
A.324
B.356
C.345
D.318
E.334
19) The number of vouchers has Anil is approximately what percent of the number of vouchers has Diya?
A.87%
B.89%
C.91%
D.85%
E.83%
20) What is the difference between the numbers of vouchers has Bharathi and Dev?
A.120
B.150
C.180
D.200
E.210
Try Data Interpretation Questions For Online Mock Test
Answers :
11) Answer: B
Difference in P = 250 – 200 = 50
Q = 250 – 100 = 150 (Highest difference)
R = 200 – 150 = 50
S = 280 – 150 = 130
T = 250 – 220 = 30
12) Answer: A
Girls in school R = 200
Girls in P and Q = 250 + 100 = 350
Required % = 200/350 * 100 = 57.14%
13) Answer: C
Boys in the schools P, R and T = 200 + 150 + 250 = 600
Girls in the schools P, R and T = 250 + 200 + 220 = 670
Required ratio = 600: 670 = 60: 67
14) Answer: B
Number of students in P = 200 + 250 = 450
Number of students in S = 150 + 280 = 430
Required % = 450/430 * 100 = 104.7%
15) Answer: E
Number of students in P = 200 + 250 = 450
Number of students in Q = 100 + 250 = 350
Number of students in R = 150 + 200 = 350
Number of students in S = 150 + 280 = 430
Number of students in T = 220 + 250 = 470 (Highest)
16) Answer: C
Required difference = (420 + 280)/2 – (360 + 240)/2
= 700/2 – 600/2
= 350 – 300
= 50
17) Answer: B
Number of gift vouchers = 125/100 * 280
= 350
Difference = 350 – 320 = 30
18) Answer: A
Required average = (320 + 420 + 280 + 360 + 240)/5
= 1620 / 5
= 324
19) Answer: B
Required percentage = 320/360 * 100
= 89%
20) Answer: C
Required difference = 420 – 240
= 180

4u2a8a
nzxw6h
gebcmo
Aptitude questions and answers for student to practice previous year exams, interview, competitive examination and entrance exams
https://www.jobz.pk/female-research-associate-required_jobs-492187.html