


Dear Aspirants, Our IBPS Guide team is providing new series of Quants Questions for SBI Clerk/ IBPS Clerk/ Prelims so the aspirants can practice it on a daily basis. These questions are framed by our skilled experts after understanding your needs thoroughly. Aspirants can practice these new series questions daily to familiarize with the exact exam pattern and make your preparation effective.
Start Quiz
Directions (01-05): Study the following information carefully and answer the questions given below.
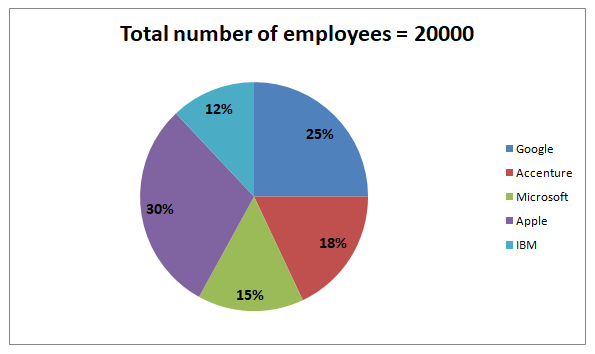
The given pie chart shows the number of employees who are working in five different companies.
1) What is the difference between the number of employees working in IBM and Microsoft?
A.400
B.500
C.600
D.700
E.900
2) What is the ratio of the average number of employees working in Google and Apple together to the average number of employees working in Microsoft and Accenture together?
A.4:3
B.5:3
C.7:3
D.3:1
E.None of these
3) What is the average number of employees working in IBM and Accenture?
A.3000
B.3200
C.3500
D.3600
E.2800
4) The number of employees working in Google and Microsoft together is what percent of the number of employees working in Accenture and Apple together?
A.71.42%
B.66.66%
C.83.33%
D.87.76%
E.77.77%
5) The number of employees working in CTS is 20% more than the number of employees working in IBM and the number of employees working in TCS is 30% more than the number of employees working in Microsoft. What is the difference between the number of employees working in TCS and CTS?
A.1020
B.1040
C.1060
D.1080
E.1100
Directions (06-10): Read the following information carefully and answer the questions.
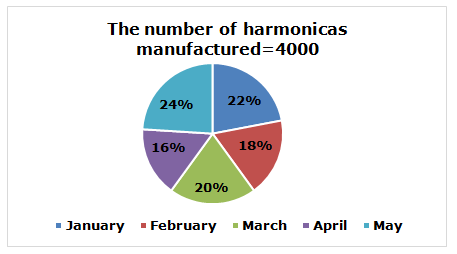
The given pie chart shows the percentage distribution of the number of harmonicas manufactured in five different months i.e. January, February, March, April and May.
6) If the ratio of the number of harmonicas manufactured in March and July is 5:4 and then find the number of harmonicas manufactured in July?
A.640
B.560
C.720
D.480
E.None of these
7) Find the difference between the number of harmonicas manufactured in May and February?
A.400
B.150
C.320
D.240
E.None of these
8) The number of harmonicas manufactured in January is what percentage more than the number of harmonicas manufactured in March?
A.25%
B.10%
C.55%
D.30%
E.None of these
9) Out of the number of harmonicas manufactured in February, 12.5% of the harmonicas are defective and then find the number of non-defective harmonicas manufactured in February?
A.720
B.600
C.630
D.750
E.None of these
10) Find the average number of harmonicas manufactured in January and February?
A.800
B.500
C.300
D.700
E.None of these
Try Data Interpretation Questions For Online Mock Test
Answers :
1) Answer: C
Required difference = (15 – 12)/100 * 20000
= 600
2) Answer: B
Required ratio = (25 + 30)/2:(15 + 18)/2
= 55:33
= 5:3
3) Answer: A
Required average = ((12 + 18)/2) * 20000/100 = 3000
4) Answer: C
Required percentage = (25 + 15)/(18 + 30) * 100 = 83.33%
5) Answer: A
Number of employees working in CTS = 120/100 * 12/100 * 20000 = 2880
Number of employees working in TCS = 130/100 * 15/100 * 20000 = 3900
Difference = 3900 – 2880 = 1020
6) Answer: A
The number of harmonicas manufactured in March=20% of 4000=20*40=800
The number of harmonicas manufactured in July=800/5*4=640
7) Answer: D
The number of harmonicas manufactured in February=18% of 4000=18*40=720
The number of harmonicas manufactured in May=24% of 4000=24*40=960
Required difference=960-720=240
8) Answer: B
Required percentage=(22%-20%)/20%*100=2/20*100=10%
9) Answer: C
The number of harmonicas manufactured in February=18% of 4000=18*40=720
The number of non-defective harmonicas manufactured in February=720/8*7=630
10) Answer: A
The number of harmonicas manufactured in February=18% of 4000=18*40=720
The number of harmonicas manufactured in January=22% of 4000=22*40=880
Required average=(880+720)/2=1600/2=800
Start Quiz
Directions (11-15): Study the following information carefully and answer the question given below.
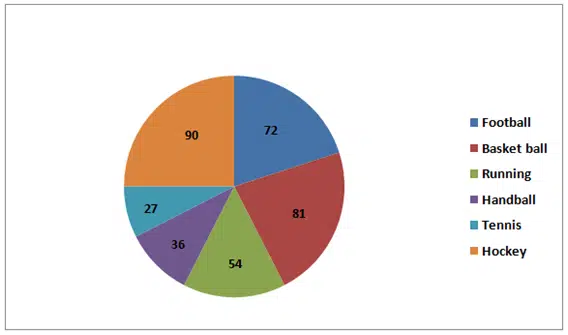
The given pie-chart shows the degree distribution of the number of students who participated in six different games namely Football, Basket ball, Running, Handball, Tennis and Hockey.
11) The number of students participated in Tennis is what percentage more or less than the number of students participated in Football?
A.62.5% less
B.62.5% more
C.65% more
D.65% less
E.None of these
12) If the number of students participated in basketball are 972, then find the difference between the number of students participated in Hockey and Running?
A.432
B.498
C.318
D.356
E.None of these
13) The number students participated in Running and Handball is how much more or less than that of in Hockey, if the total number of students participated in six different games is 7200?
A.0
B.450
C.760
D.840
E.None of these
14) 20% of students participated in Tennis who won the game which is 36. Then find the number of students participated in Handball?
A.236
B.268
C.250
D.240
E.None of these
15) Find the ratio of the number of Students participated in Football and running to the number of students participated in Tennis?
A.14:3
B.3:14
C.11:5
D.5:11
E.None of these
Directions (16-20): Study the following information carefully and answer the questions given below.
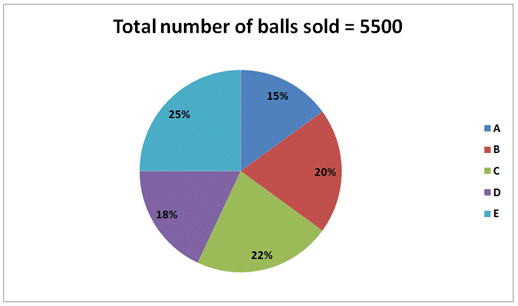
The given pie chart shows the percentage distribution of the number of balls sold in five different shops namely A, B, C, D and E.
16) If the ratio of the number of cricket and football sold in C is 3:2. If 50% of the cricket ball and 25% of football sold in C are pink color, then find the number of other than pink balls sold in C, if only cricket and football sold in C?
A.726
B.732
C.736
D.722
E.None of these
17) If the number of red balls sold in E is 475, then find the ratio of the number of red and other than red color balls sold in E?
A.17:32
B.18:35
C.19:36
D.19:32
E.17:35
18) The number of balls sold in A is what percent of the number of balls sold in D?
A.81.81%
B.83.33%
C.84.44%
D.88.88%
E.92.92%
19) What is the average number of balls sold in B, D and E?
A.1155
B.1159
C.1165
D.1170
E.1175
20) The number of red balls sold in F is 20% more than the number of balls sold in A and the number of yellow balls sold in F is 40% less than the number of balls sold in B. What is the difference between the number of balls sold in E and the total number of red and yellow balls sold in F?
A.245
B.255
C.275
D.265
E.285
Try Data Interpretation Questions For Online Mock Test
Answers :
11) Answer: A
Required Percentage = (270-720)/720 * 100 = -62.5% = 62.5% less
12) Answer: A
The number of students participated in basketball (810) = 972
Required difference ( 900 – 540= 360 ) = (36/81)*972 = 432
13) Answer: A
3600 = 7200
Required difference = (540+360) – 900 = 900 – 900 = 0
14) Answer: D
Number of students who won the game = 36
Therefore number of students participated in tennis ( 270) = 100% = (100/20)*36 = 180
Number of students participated in Handball (36o) = (36/27)*180 = 240
15) Answer: A
Required ratio = (72+54) : 27 = 126 : 27= 14:3
16) Answer: A
Number of cricket balls sold in C = 3/5 * 22/100 * 5500 = 726
Number of footballs sold in C = 2/5 * 22/100 * 5500 = 484
Required total = 50/100 * 726 + 75/100 * 484 = 726
17) Answer: C
Other color balls = 25/100 * 5500 – 475 = 900
Required ratio = 475:900
= 19:36
18) Answer: B
Required % = 15/18 * 100 = 83.33%
19) Answer: A
Required average = (20 + 18 + 25)/300 * 5500
= 1155
20) Answer: C
Number of red balls sold in F = 120/100 * 15/100 * 5500 = 990
Number of yellow balls sold in F = 60/100 * 20/100 * 5500 = 660
Required difference = (990 + 660) – 25/100 * 5500
= 275
Start Quiz
Directions (21-25): Study the following information carefully and answer the questions given below.
The below pie chart shows the percentage distribution of number of contractors in five different departments in a public sector company
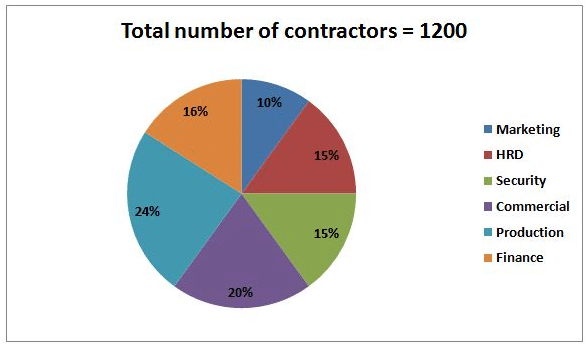
21) What is the total number of contractors in security and finance together?
A.372
B.284
C.168
D.154
E.None of these
22) In production department, if 50% of the contractors are married, then what is the number of unmarried contractors in the production department?
A.122
B.144
C.136
D.158
E.None of these
23) What is the difference between the total number of contractors in marketing and HRD department together and the number of contractors in Finance?
A.100
B.102
C.104
D.106
E.108
24) 40% of the contractors in security department is ex-servicemen. What is the number of contractors from security department who is not ex-servicemen?
A.100
B.102
C.104
D.106
E.108
25) Find the respective ratio of the number of contractors in production department to the number of contractors in Finance department.
A.3: 2
B.3: 4
C.2: 3
D.3: 5
E.None of these
Directions (26-30): Study the following information carefully and answer the questions given below.
The pie chart represents the number of employees working in five different departments in a company in 2019.
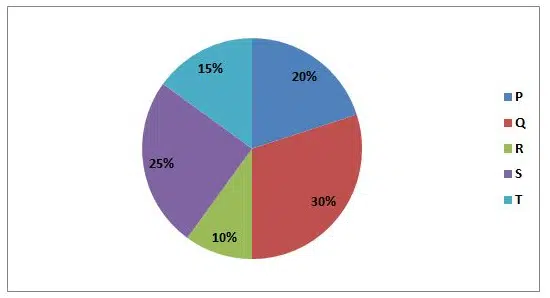
26) In the year 2019, the difference between the number of employees working in departments Q and S was 40, then find the number of employees working in department R.
A.20
B.40
C.60
D.80
E.None of these
27) In the year 2019, the number of employees working in department T was what percent more than the number of employees working in department R?
A.25%
B.50%
C.75%
D.100%
E.None of these
28) If the difference between the number of employees working in department P and R is 80, then find the difference between the number of employees working in department R and T.
A.20
B.40
C.60
D.80
E.None of these
29) If the total number of employees working in the company in 2019 is 800, find the ratio of the number of employees working in the department S to the number of employees working in department Q.
A.5: 6
B.3: 4
C.1: 2
D.2: 3
E.None of these
30) If the total number of employees working in departments P and T is 280, then find the number of employees working in departments S and R together?
A.140
B.160
C.280
D.220
E.None of these
Try Data Interpretation Questions For Online Mock Test
Answers :
21) Answer: A
Number of contractors in Security = 15% of 1200 = 180
Number of contractors in Finance = 16% of 1200 = 192
Total contractors = 180 + 192 = 372
22) Answer: B
Number of contractors in production = 24% of 1200 = 288
Number of unmarried contractors in production = 50% of 288 = 144
23) Answer: E
Number of contractors in Marketing and HRD = 10% of 1200 + 15% of 1200 = 300
Number of contractors in Finance = 16% of 1200 = 192
Required difference = 300 – 192 = 108
24) Answer: E
Number of contractors in Security = 15% of 1200 = 180
Number of contractors in Security who are not ex-service men = (100 – 40)% of 180
= 108
25) Answer: A
Required ratio = (24% of 1200): (16% of 1200)
= 288: 192
= 3: 2
26) Answer: D
Let x be the total employees.
30% of x – 25% of x = 40
=> x = 800
Number of employees working in department R = 10% of 800 = 80
27) Answer: B
Let x be the total employees.
Number of employees working in department T = 15% of x = 0.15x
Number of employees working in department R = 10% of x = 0.1x
Required % = (0.15x – 0.1x)/0.1x * 100 = 50%
28) Answer: B
Let x be the total employees.
20% of x – 10% of x = 80
=> x = 800
Difference between the number of employees working in department R and T = 15% of x – 10% of x = 120 – 80 = 40
29) Answer: A
Ratio of the employees working in the department S to the number of employees working in department Q = 25: 30
= 5: 6
30) Answer: C
Let x be the total employees.
20% of x + 15% of x = 280
=> x = 800
No. of employees working in departments S and R together = (25% + 10%) of 800
= 35% of 800
= 280
Start Quiz
Directions (31-35): Study the following information carefully and answer the questions given below.
The given pie chart shows the percentage distribution of the number of books sold in five different shops.
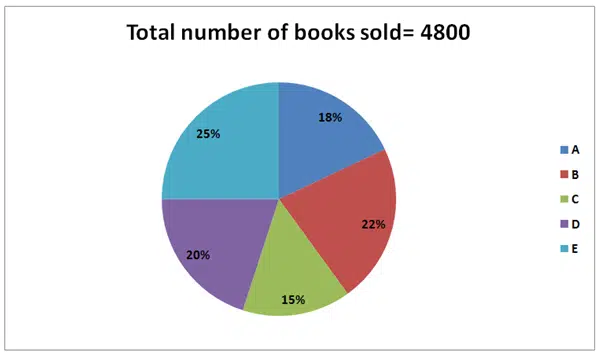
31) The ratio of the number of science and history books sold in B is 5:3. Find the number of science books sold in B, if only science and history books sold in B?
A.640
B.660
C.620
D.600
E.680
32) The number of books sold in F is 40% more than that of D. If the ratio of the number of books sold to unsold in F and A is 7:5 and 9:4 respectively, then find the difference between the number of unsold books in F and A?
A.556
B.572
C.576
D.564
E.560
33) What is the ratio of the number of books sold in C and E together to the number of books sold in A and B together?
A.1:1
B.2:1
C.1:2
D.3:2
E.None of these
34) The number of science books sold in E is 45% of the total number of books sold in the same shop and the ratio of the number of science and English books sold in C is 7:8. Find the total number of science books sold in E and C, if only science and English books sold in E and C?
A.872
B.874
C.878
D.876
E.892
35) Find the average number of books sold in A, D and E together?
A.1008
B.1004
C.1010
D.1012
E.1016
Directions (36-40): Read the following information carefully and answer the questions.
The given pie chart shows the percentage distribution of the number of students who play sports games (football and cricket) in five different schools (A, B, C, D and E).
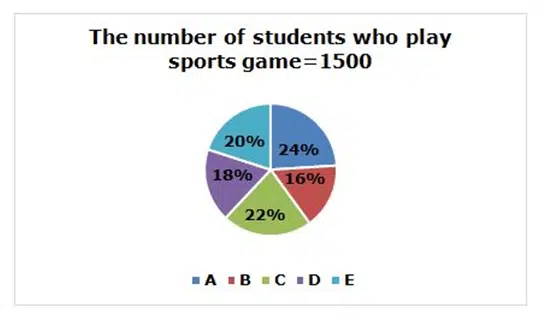
36) If the ratio of the number of students who play football and cricket in school C is 2:1 and then find the number of students who play cricket in school C?
A.110
B.170
C.190
D.150
E.None of these
37) The number of students who play sports games in school E is approximately how much percentage more/less than the number of students who play sports games in school A?
A.16% less
B.11% less
C.15% less
D.17% less
E.None of these
38) If the ratio of the number of students who play football and cricket in school D is 5:4 and the ratio of the number of students who play cricket in schools D and F is 3:4. Then find the number of students who play cricket in school F?
A.210
B.160
C.70
D.110
E.None of these
39) Find the difference between the number of students who play sports games in schools A and B?
A.170
B.150
C.120
D.180
E.None of these
40) Find the average number of students who play sports games in schools B, D and E?
A.270
B.120
C.400
D.330
E.None of these
Try Data Interpretation Questions For Online Mock Test
Answers :
31) Answer: B
Required total = 5/8 * 22/100 * 4800 = 660
32) Answer: C
Number of unsold books in F = 140/100 * 20/100 * 4800 * 5/7 = 960
Number of unsold books in A = 4/9 * 18/100 * 4800 = 384
Difference = 960 – 384 = 576
33) Answer: A
Required ratio = (15 + 25):(18 + 22)= 40:40 = 1:1
34) Answer: D
Required total = 45/100*25/100*4800 + 7/15*15/100*4800= 540+336= 876
35) Answer: A
Required average = (18 + 20 + 25)/300 * 4800 = 1008
36) Answer: A
The number of students who play sports games in school C=22% of 1500=22*15=330
The number of students who play cricket in school C=330/3*1=110
37) Answer: D
Required percentage=(20%-24%)/24%*100=-4%/24%*100=-100/6=-16.667 =17% less
38) Answer: B
The number of students who play sports games in school D=18% of 1500=15*18=270
The number of students who play cricket in school D=270/9*4=120
The number of students who play cricket in school F=120/3*4=160
39) Answer: C
Required difference=(24-16)% of 1500=8*15=120
40) Answer: A
Percentage of the average number of students who play sports games in schools B, D and E=(16+18+20)%/3=54%/3=18%
Required average=18% of 1500=18*15=270

Aptitude questions and answers for student to practice previous year exams, interview, competitive examination and entrance exams