


Dear Aspirants, Our IBPS Guide team is providing new series of Quants Questions for IBPS PO Prelims 2023 so the aspirants can practice it on a daily basis. These questions are framed by our skilled experts after understanding your needs thoroughly. Aspirants can practice these new series questions daily to familiarize with the exact exam pattern and make your preparation effective.
Start Quiz
Directions (01-05): Study the following information carefully and answer the questions given below.
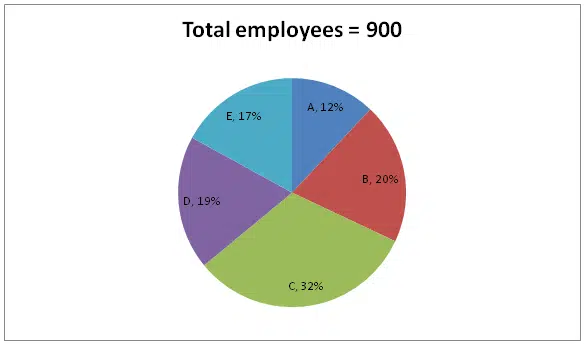
The given pie chart shows the percentage distribution of the total number of employees in five different companies namely A, B, C, D and E.
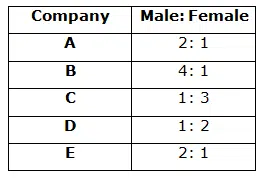
The given table shows the ratio of the number of male to female employees in that companies.
1) Find the total number of female employees in all the companies together?
A.453
B.456
C.450
D.448
E.None of these
2) What is the difference between the number of male employees in C and the number of female employees in B?
A.30
B.32
C.36
D.28
E.24
3) Total number of male employees in E is approximately what percent more than the number of male employees in D?
A.75%
B.77%
C.79%
D.81%
E.73%
4) The total number of male employees in A, B and C together is what percent of the total number of employees in A, B and C together?
A.45%
B.48%
C.36%
D.50%
E.55%
5) In company F, the number of male employees is 25% more than the number of male employees in B and the number of female employees in F is 25% more than the number of female employees in A. What is the ratio of the total number of employees in F to C?
A.25: 32
B.24: 31
C.26: 33
D.31: 26
E.None of these
Directions (06-10): Study the following information carefully and answer the questions given below.
The given pie chart shows the number of five different products manufactured in 2018.
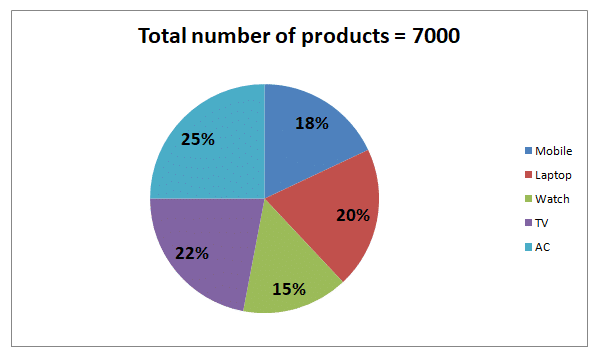
6) If the ratio of the number of sold to unsold Watches and TVs is 7:8 and 3:2 respectively, then what is the difference between the total number of sold watches and TVs together and the total number of unsold watches and TVs together?
A.238
B.243
C.256
D.240
E.None of these
7) What is the difference between the number of Laptops and ACs manufactured in 2018?
A.340
B.450
C.330
D.350
E.None of these
8) If the number of non defective to defective mobiles, laptops and ACs manufactured in the ratio of 5:4, 3:1 and 3:2 respectively, then find the sum of the number of defective mobiles, laptops and ACs manufactured together?
A.1570
B.1590
C.1610
D.1620
E.None of these
9) In 2019, the number of mobiles and TVs manufactured is increased by 20% and 10% respectively, then find the total number of mobiles and TVs manufactured in 2019.
A.3206
B.3346
C.3118
D.3406
E.None of these
10) The number of defective laptops manufactured in 2018 was 380 which is 76% of the number of defective ACs manufactured in 2018. What is the difference between the number of defective and non defective ACs manufactured in 2018?
A.800
B.750
C.600
D.700
E.850
Try Data Interpretation Questions For Online Mock Test
Answers :
Directions (1-5) :
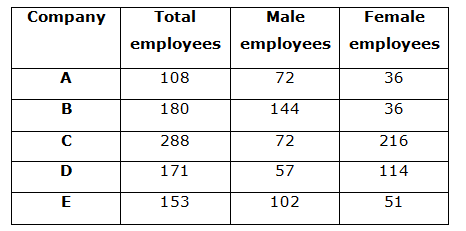
In Company A,
Total number of employees=900*12/100=108
Number of male employees=108/3*2=72
Number of female employees=108/3*1=36
Similarly, we can calculate other companies values also.
1) Answer: A
Total number of female employees = 36 + 36 + 216 + 114 + 51 = 453
2) Answer: C
Required difference = 72 – 36 = 36
3) Answer: C
Required percentage = (102 – 57)/57 * 100 = 79%
4) Answer: D
Required percentage = (72 + 144 + 72)/(108 + 180 + 288) * 100
=288*100/576= 50%
5) Answer: A
Number of male employees in F = 125/100 * 144 = 180
Number of female employees in F = 125/100 * 36 = 45
Total number of employees in F = 180 + 45 = 225
Required ratio = 225: 288
= 25: 32
6) Answer: A
Number of sold Watch = 15/100 * 7000 * 7/15 = 490
Number of unsold watch = 15/100 * 7000 * 8/15 = 560
Number of sold TV = 22/100 * 7000 * 3/5 = 924
Number of unsold TV = 22/100 * 7000 * 2/5 = 616
Required difference = (490 + 924) – (560 + 616) = 238
7) Answer: D
Required answer = 5/100 * 7000 = 350
8) Answer: C
Defective mobile = 18/100 * 7000 * 4/9 = 560
Defective Laptop = 20/100 * 7000 * ¼ = 350
Defective AC = 25/100 * 7000 * 2/5 = 700
Required sum = 560 + 350 + 700 = 1610
9) Answer: A
Number of mobile in 2019 = 18/100 * 7000 * 120/100 = 1512
Number of TV in 2019 = 22/100 * 7000 * 110/100 = 1694
Required total = 1512 + 1694 = 3206
10) Answer: B
Total number of defective AC = 100/76 * 380 = 500
Total number of AC manufactured in 2018 = 25/100 * 7000 = 1750
Number of non defective AC = 1750 – 500 = 1250
Required Difference = 1250 – 500 = 750
Start Quiz
Directions (01-05): Study the following information carefully and answer the questions given below.
The given pie chart shows the percentage distribution of the number of mobiles manufactured in five different companies namely A, B, C, D and E in 2018.
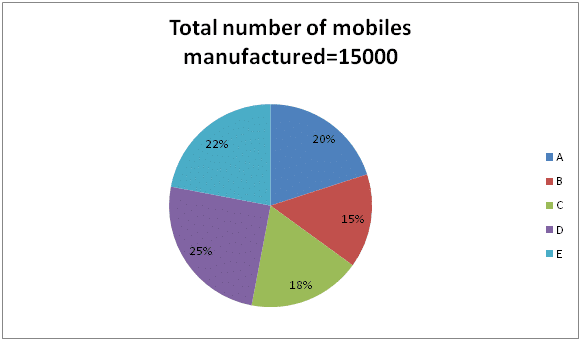
1) If the ratio of the number of mobile to watch manufactured in company A is 6:5 and 45% of the watches are sold in company A, then find the number of watches unsold in company A?
A.1265
B.1285
C.1325
D.1375
E.None of these
2) What is the difference between the number of mobile manufactured in C and E?
A.400
B.500
C.600
D.700
E.None of these
3) What is the ratio of the average number of mobile manufactured in D, B and C together to the average number of mobile manufactured in A and E together?
A.58:63
B.11:12
C.58:62
D.57:61
E.None of these
4) If the number of laptops manufactured in 2019 is 40% more than the number of mobile manufactured in E in 2018, then find the total number of laptops manufactured in 2019?
A.3890
B.4380
C.4620
D.4870
E.None of these
5) If the total number of mobiles manufactured in 2019 is decreased by 20% compared with the previous year and the number of mobiles manufactured in A, B, C, D and E in 2019 is in the ratio of 7: 5: 3: 8: 1 respectively, then what is the total number of mobiles manufactured in B, D and E in 2019?
A.5000
B.6000
C.7000
D.8000
E.None of these
Directions (06-10): Study the following information carefully and answer the questions given below.
The given pie chart shows the percentage distribution of the number of mobile manufactured in five different companies namely Nokia, Samsung, Sony, Apple and Vivo in 2018.
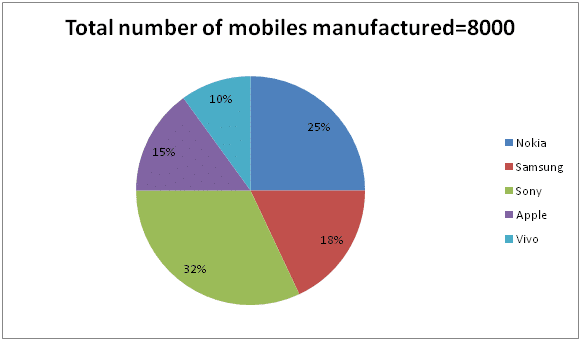
6) What is the difference between the total number of mobiles manufactured in Vivo and Samsung together and the total number of mobiles manufactured in Sony?
A.280
B.320
C.360
D.400
E.420
7) If the ratio of the number of mobiles sold to that of unsold in Apple is 2: 1 and one apple mobile is sold at Rs.4000, then find the total revenue (in lakhs) generated from selling Apple mobiles.
A.Rs.32 lakhs
B.Rs.36 lakhs
C.Rs.28 lakhs
D.Rs.20 lakhs
E.None of these
8) What is the average number of mobile manufactured in Samsung, Nokia and Sony together?
A.1800
B.2000
C.2100
D.2400
E.None of these
9) If the ratio of the number of mobiles sold to unsold in Nokia, Samsung and Vivo is 3: 2, 7: 5 and 2: 3 respectively, then find the total number of mobiles sold in Nokia, Samsung and Vivo?
A.2360
B.2180
C.1990
D.2000
E.None of these
10) Number of Apple mobiles manufactured is what percent of the number of Nokia mobiles manufactured?
A.40%
B.50%
C.60%
D.70%
E.None of these
Try Data Interpretation Questions For Online Mock Test
Answers :
1) Answer: D
Number of mobile from A = 20/100 * 15000 = 3000
Number of watches = 5/6 * 3000 = 2500
Number of watches unsold = 55/100 * 2500 = 1375
2) Answer: C
Required difference = (22 – 18)/100 * 15000 = 600
3) Answer: A
Average of D, B and C = ((15 + 18 + 25)/3)/100 * 15000 = 2900
Average of A and E = ((20 + 22)/2)/100 * 15000 = 3150
Required ratio = 2900:3150
= 58:63
4) Answer: C
Number of mobile manufactured in E = 22/100 * 15000 = 3300
Number of laptop manufactured in 2019 = 3300 * 140/100 = 4620
5) Answer: C
Number of mobile in 2019 = 80/100 * 15000 = 12000
Number of mobile manufactured in B, D, E = 14/24 * 12000 = 7000
6) Answer: B
Difference = 32% – (10 + 18)% = 4%
Required difference = 4/100 * 8000 = 320
7) Answer: A
Number of Apple mobiles manufactured = 15/100 * 8000 = 1200
Sold apple mobiles = 2/3 * 1200 = 800
Total revenue = 800 * 4000 = Rs. 3200000
8) Answer: B
Number of Samsung manufactured = 18/100 * 8000 = 1440
Number of Nokia manufactured = 25/100 * 8000 = 2000
Number of Sony manufactured = 32/100 * 8000 = 2560
Required Average = (1440 + 2000 + 2560)/3 = 2000
9) Answer: A
Number of Samsung mobiles manufactured = 18/100 * 8000 = 1440
Number of Nokia mobiles manufactured = 25/100 * 8000 = 2000
Number of Vivo mobiles manufactured = 10/100 * 8000 = 800
Number of sold mobiles in Nokia = 3/5 * 2000 = 1200
Number of sold mobiles in Samsung = 7/12 * 1440 = 840
Number of sold mobiles in Vivo = 800 * 2/5 = 320
Required answer = 1200 + 840 + 320 = 2360
10) Answer: C
Required percentage = 15/25 * 100 = 60%
Start Quiz
Directions (11-15): Study the following information carefully and answer the questions given below.
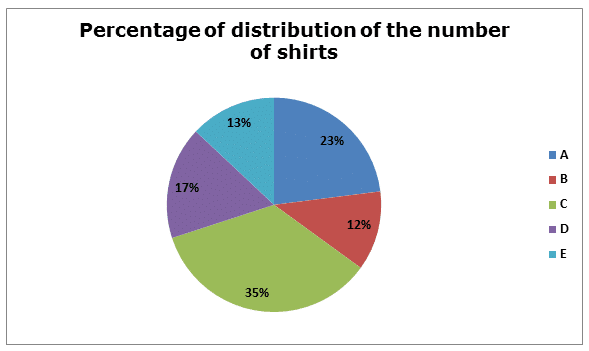
The given pie chart shows the percentage distribution of the number of shirts sold in five different shops in March.
Difference between the numbers of shirts sold in B and D is 900.

11) If the ratio of the number of shirts to Sarees sold in E is 13:17, then find the number of sarees sold in E?
A.3040
B.3050
C.3060
D.3070
E.3080
12) If the number of shirts sold on May is 20% more than the total number of shirts sold on March and the number of shirts sold in D on May is 15% of the total number of shirts sold on May. Find the number of shirts sold in D on May?
A.3240
B.3250
C.3260
D.3280
E.3230
13) If the number of shirts sold in F is 15% of the total number of shirts sold in B and A together and the ratio of the number of shirts to T-shirts sold in F is 7:9, then find the number of T-shirts sold in F?
A.1205
B.1210
C.1220
D.1215
E.1225
14) If the number of shirts sold in F is 25% more than the number of shirts sold in E and the ratio of the number of shirts to sarees sold in A is 4:3. What is the difference between the number of shirts sold in F and the number of Sarees sold in A?
A.150
B.180
C.200
D.160
E.140
15) If the number of shirts sold in C on April is 50% more than the number of shirts sold in C on March, then find the number of shirts sold in C on April?
A.9450
B.9460
C.9480
D.9490
E.9440
Directions (16-20): Study the following information carefully and answer the questions given below.
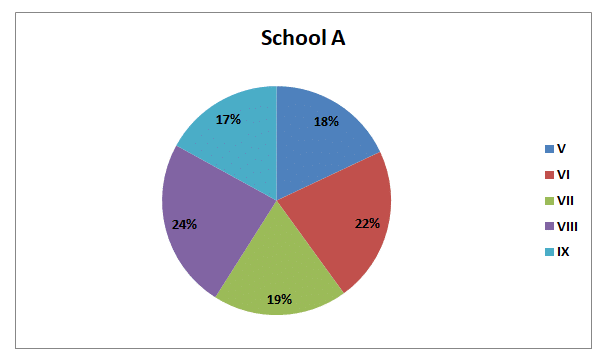
The given pie chart shows the percentage distribution of number of students in five different classes in school A.
The given pie chart shows the percentage distribution of number of students in five different classes in school B. Total number of students in school B is five-sixth of the total number of students in school A.
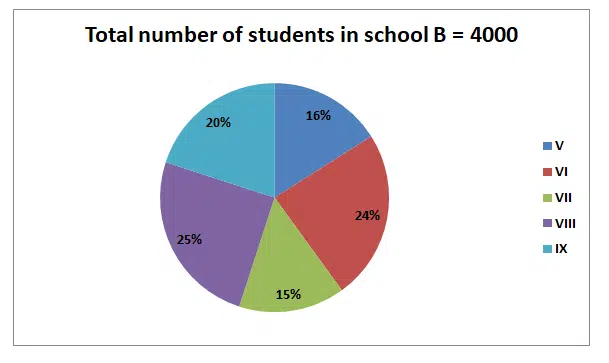
16) What is the average number of students in class IX of both schools?
A.804
B.806
C.808
D.810
E.812
17) The number of students in class V of both schools together is what percent of the total number of students in school A?
A.29.98%
B.31.33%
C.33.33%
D.36.36%
E.44.44%
18) What is the ratio of the number of students in class VII to VIII of school A?
A.17:23
B.9:12
C.19:24
D.10:11
E.None of these
19) What is the difference between the number of students in VII and VIII of school A and B together?
A.620
B.630
C.640
D.660
E.680
20) What is the difference between the number of students in class VI in school A and B?
A.96
B.98
C.100
D.92
E.90
Try Data Interpretation Questions For Online Mock Test
Answers :
Directions (11-15) :
Number of shirts sold in A on March = 23/(17-12) * 900 = 4140
Number of shirts sold in B on March = 12/5 * 900 = 2160
Number of shirts sold in C on March = 35/5 * 900 = 6300
Number of shirts sold in D on March = 17/5 * 900 = 3060
Number of shirts sold in E on March = 13/5 * 900 = 2340
11) Answer: C
Number of Sarees sold in E = 17/13 * 2340 = 3060
12) Answer: A
Number of shirts sold in D on May = 15/100 * 120/100 * 100/5 * 900
= 3240
13) Answer: D
Number of T -shirts sold in F = 15/100 * (4140 + 2160) * 9/7 = 1215
14) Answer: B
Number of shirts sold in F = 125/100 * 2340 = 2925
Number of shirts sarees sold in A = 3/4 * 4140 = 3105
Difference = 3105 – 2925 = 180
15) Answer: A
Number of shirts sold in C on April = 150/100 * 6300 = 9450
16) Answer: C
Number of students in IX of school A = 17/100 * 6/5 * 4000 = 816
Number of students in IX of school B = 20/100 * 4000 = 800
Required average = (816 + 800)/2
= 808
17) Answer: B
Number of students in V of school A = 18/100 * 6/5 * 4000 = 864
Number of students in V of school B = 16/100 * 4000 = 640
Required percentage = (864 + 640)/(4000 * 6/5) * 100
= (1504/4800) * 100
= 31.33%
18) Answer: C
Required ratio = 19:24
19) Answer: C
Number of students in class VII of school A = 19/100 * 6/5 * 4000
= 912
Number of students in class VIII of school A = 24/100 * 6/5 * 4000 = 1152
Number of students in class VII of school B = 15/100 * 4000 = 600
Number of students in class VIII of school B = 25/100 * 4000 = 1000
Difference = (1152 + 1000) – (912 + 600)
= 640
20) Answer: A
Number of students in VI of school A = 6/5 * 4000 * 22/100 = 1056
Number of students in VI of school B = 24/100 * 4000 = 960
Difference = 1056 – 960 = 96
Start Quiz
Directions (21-25): Study the following information carefully and answer the questions given below.
The given pie chart shows the number of bulbs manufactured in five different companies namely V, W, X, Y and Z.
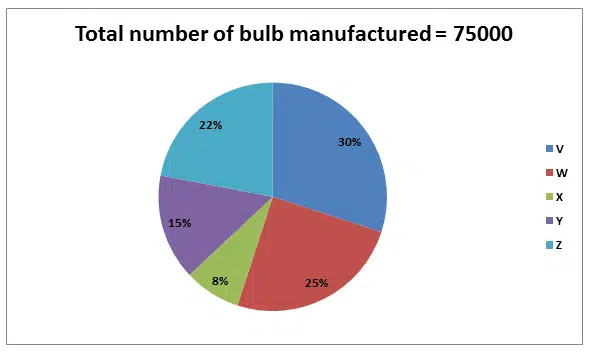
The given table shows the ratio of the number of bulbs sold to unsold in five different companies.
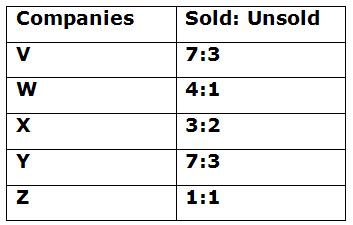
21) The number of unsold bulbs in X is what percent of the number of sold bulbs in V?
A.15.23%
B.17.65%
C.13.56%
D.20.93%
E.12.12%
22) What is the average number of unsold bulbs in all the companies together?
A.4900
B.4905
C.4910
D.4915
E.4920
23) The number of bulbs sold in F is 20% more than the number of bulbs sold in Z and the number of unsold bulbs in F is 30% more than the number of bulbs sold in W. Find the total number of bulbs manufactured in F?
A.28900
B.29400
C.29600
D.29500
E.28800
24) What is the ratio of the number of bulbs sold in Y and X together to the total number of bulbs manufactured in all the companies together?
A.143:1000
B.147:1000
C.141:1000
D.149:1000
E.153:1000
25) What is the difference between the total number of bulbs manufactured in Z and X together and W and V together?
A.18250
B.18550
C.18750
D.18450
E.18520
Directions (26-30): Study the following information carefully and answer the questions given below.
The given pie chart shows the percentage distribution of the number of shirts sold in five different shops in March.
Difference between the numbers of shirts sold in B and D is 900.
26) If the number of shirts sold in C on April is 50% more than the number of shirts sold in C on March, then find the number of shirts sold in C on April?
A.9450
B.9460
C.9480
D.9490
E.9440
27) The number of shirts sold in F is 25% more than the number of shirts sold in E and the ratio of the number of shirts to sarees sold in A is 4:3. What is the difference between the number of shirts sold in F and the number of Sarees sold in A?
A.150
B.180
C.200
D.160
E.140
28) If the number of shirts sold in F is 15% of the total number of shirts sold in B and A together and the ratio of the number of shirts to T-shirts sold in F is 7:9, then find the number of T-shirts sold in F?
A.1205
B.1210
C.1220
D.1215
E.1225
29) If the number of shirts sold on May is 20% more than the total number of shirts sold on March and the number of shirts sold in D on May is 15% of the total number of shirts sold on May. Find the number of shirts sold in D on May?
A.3240
B.3250
C.3260
D.3280
E.3230
30) If the ratio of the number of shirts to Sarees sold in E is 13:17, then find the number of sarees sold in E?
A.3040
B.3050
C.3060
D.3070
E.3080
Try Data Interpretation Questions For Online Mock Test
Answers :
DIrections (21-25) :
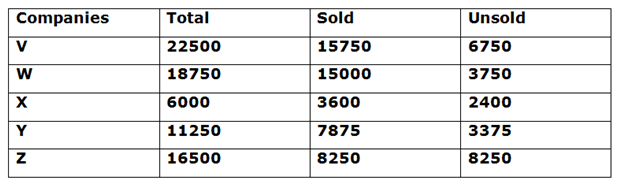
21) Answer: A
Required percentage = 2400/15750 * 100 = 15.23%
22) Answer: B
Required average = (6750 + 3750 + 2400 + 3375 + 8250)/5= 4905
23) Answer: B
Required total = 120/100 * 8250 + 130/100 * 15000= 29400
24) Answer: E
Required percentage = (7875 + 3600):75000
= 153:1000
25) Answer: C
Required difference = ((30 + 25) – (22 + 8))/100 * 75000 = 18750
Directions (26-30) :
Number of shirts sold in A on March = 23/(17-12) * 900 = 4140
Number of shirts sold in B on March = 12/5 * 900 = 2160
Number of shirts sold in C on March = 35/5 * 900 = 6300
Number of shirts sold in D on March = 17/5 * 900 = 3060
Number of shirts sold in E on March = 13/5 * 900 = 2340
26) Answer: A
Number of shirts sold in C on April = 150/100 * 6300 = 9450
27) Answer: B
Number of shirts sold in F = 125/100 * 2340 = 2925
Number of shirts sarees sold in A = 3/4 * 4140 = 3105
Difference = 3105 – 2925 = 180
28) Answer: D
Number of T -shirts sold in F = 15/100 * (4140 + 2160) * 9/7 = 1215
29) Answer: A
Number of shirts sold in D on May = 15/100 * 120/100 * 100/5 * 900
= 3240
30) Answer: C
Number of Sarees sold in E = 17/13 * 2340 = 3060
Start Quiz
Directions (31-35): Study the following information carefully and answer the questions given below.
The given pie chart shows the number of persons who has the aadhar card in five different states.
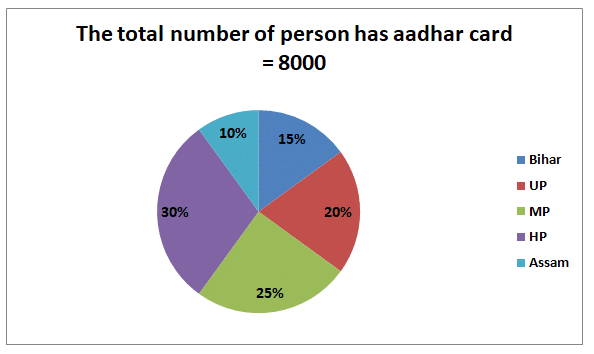
31) The sum of the number of persons has aadhar card in UP and HP together is what percent of the number of persons has the aadhar card in HP and Assam together?
A.125%
B.135%
C.150%
D.120%
E.115%
32) What is the difference between the average numbers of persons has aadhar in Bihar, UP and MP together and the average number of persons has aadhar in HP and Assam?
A.300
B.400
C.500
D.200
E.None of these
33) Ratio of the number of male and female person has the aadhar in UP and Assam is 3:1 and 3:2 respectively. The number of female persons has aadhar card in UP and Assam together is approximately what percent of the number of male persons has the aadhar card in UP and Assam together?
A.45%
B.41%
C.39%
D.43%
E.37%
34) What is the difference between the number of persons has aadhar card in HP and MP?
A.300
B.400
C.500
D.600
E.200
35) If 40% of the persons who has the aadhar card in Bihar, then find the number of persons who did not have aadhar in Bihar?
A.1850
B.1900
C.1800
D.1680
E.None of these
Directions (36-40): Study the pie chart carefully and answer the question given below.
The given pie chart shows the 5 different colour balls i.e. Red, Blue, Yellow, Green and Pink in a bag.
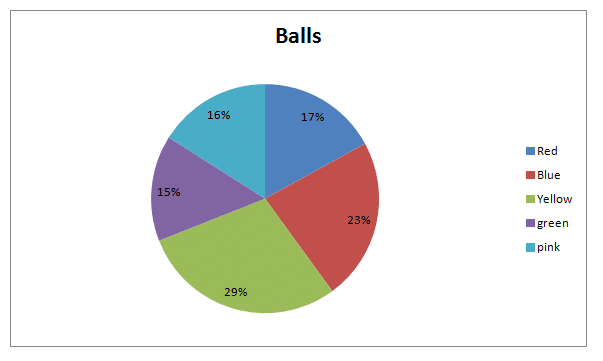
36) If the number of red balls in the bag is decreased by 20%, find the difference between the number of pink and green balls.
A.1
B.8
C.5
D.6
E.Cannot be determined
37) If the difference between the number of Red and green ball is 34, find the ratio of average number of Red and Yellow balls to the average number of all other balls.
A.39: 32
B.23: 18
C.123: 169
D.23: 29
E.289: 361
38) Find the probability of taking one pink ball from the bag.
A.1/25
B.3/12
C.4/25
D.7/62
E.Cannot be determined
39) If the difference between the Blue and Yellow balls in the bag is 36, find the number of red balls in the bag.
A.103
B.102
C.101
D.105
E.117
40) The difference between the Red and Blue balls in the bag is 42. If another bag contains 30% more balls than the bag, another bag also contains six different colour balls, then find the average number of balls in that bag.
A.182
B.140
C.162
D.150
E.192
Try Data Interpretation Questions For Online Mock Test
Answers :
31) Answer: A
Required percentage = (20 + 30)/(10 + 30) * 100
= 125%
32) Answer: E
Required difference = (15 + 20 + 25)/300 * 8000 – (30 + 10)/200 * 8000
= 1600 – 1600
= 0
33) Answer: D
Number of male persons has aadhar in UP and Assam = 20/100 * 8000 * ¾ + 10/100 * 8000 * 3/5
= 1200 + 480
= 1680
Number of female has aadhar in UP and Assam = 20/100 * 8000 * ¼ + 10/100 * 8000 * 2/5
= 400 + 320 = 720
Required percentage = 720/1680 * 100
= 43%
34) Answer: B
Required difference = (30 – 25)/100 * 8000
= 400
35) Answer: C
Required total = 15/100 * 8000 * 60/40 = 1800
36) Answer: E
Total number of balls is not given, so we can’t find the Answer.
37) Answer: B
The difference between the Red and green ball = 34
=>17% – 15% = 34
=> 2% = 34
Total number of balls in the bag = 34/2 * 100 = 1700
Red balls in the bag = 17% = 17/100 * 1700 = 289
Blue balls in the bag = 23% = 23/100 * 1700 = 391
Yellow balls in the bag = 29% = 29/100 * 1700 = 493
Green balls in the bag = 15% = 15/100 * 1700 = 255
Pink balls in the bag = 16% = 16/100 * 1700 = 272
Required ratio = [(289 + 493)/2] : [(391 + 255 + 272)/3]
=> 391: 306=>23:18
38) Answer: C
Pink balls in the bag = 16%
Total number of balls = 100%
Probability of taking one pink ball = 16%C1%/100%C1%
= 4 /25
39) Answer: B
Blue balls in the bag = 23%
Yellow balls in the bag = 29%
Total balls in the bag = 36/6 * 100 = 600
Red balls in the bag = 17/100 * 600 = 102
40) Answer: A
Red balls in the bag = 17%
Blue balls in the bag = 23%
Total number of balls in the bag = 42/6 * 100 = 700
Balls in another bag= 700 * 130/100 = 910
Required average = 910/5 = 182

Aptitude questions and answers for student to practice previous year exams, interview, competitive examination and entrance exams