


Quantitative Aptitude Questions (Data Interpretation) for IBPS Clerk Mains Day-31:
Dear Readers, IBPS is conducting Online Mains Examination for the recruitment of Clerical Cadre. Main Examination of IBPS Clerk was scheduled from 21st Jan 2018. To enrich your preparation here we have providing new series of Data Interpretation – Quantitative Aptitude Questions. Candidates those who are appearing in IBPS Clerk Main Exam can practice these Quantitative Aptitude Average questions daily and make your preparation effective.
[WpProQuiz 1099]
Click “Start Quiz” to attend these Questions and view Solutions
Directions (1-5): Study the following information carefully and answer the questions given below:
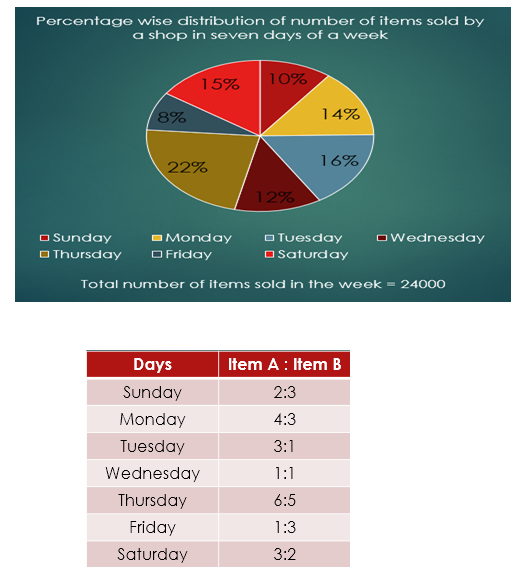
Q1. Total number of items sold in Sunday, Monday and Tuesday together is what percent of the total number of items sold in Wednesday, Thursday and Friday together?
- 91.52%
- 95.23%
- 85.24%
- 88.53%
- none of these
Q2. Total number of item A sold in Monday and Tuesday together is what percent more than the total number of item B sold in Friday and Saturday together?
- 65.76%
- 66.67%
- 56.67%
- 55.76%
- none of these
Q3. Find the respective ratio of total number of item A sold in Thursday, Friday and Saturday together and total number of item B sold in Monday, Tuesday and Wednesday together.
- 15:21
- 21:15
- 23:16
- 16:23
- none of these
Q4. Total number of item B sold in Tuesday, Wednesday and Thursday together is what percent of the total number of items sold throughout the week?
- 20%
- 30%
- 25%
- 15%
- none of these
Q5. Find the total number of item A sold throughout the week.
- 16420
- 14520
- 12720
- 13750
- none of these
Directions (6-10): Study the following information carefully and answer the questions given below:
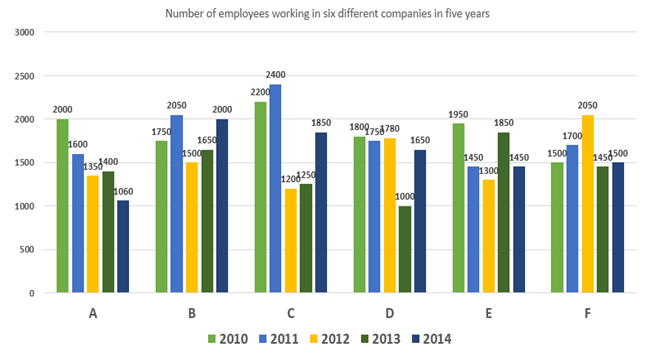
6.Total number of employees working in all the companies in 2010 is what percent of total number of employees working in all the companies in 2014?
- 108.17%
- 117.77%
- 155.57%
- 112.13%
- none of these
- Total number of employees working in C and D together in 2011 is what percent more than that of A and B together in 2013?
- 32.16%
- 36.06%
- 34.32%
- 28.42%
- none of these
- Find the respective ratio of total number of employees working in 2011 and that in 2012 in all the companies.
- 355 : 321
- 355 : 231
- 365 : 306
- 306 : 365
- none of these
- What is the difference between total number of employees working in company B in all the years together and that in D in all the years together?
- 940
- 930
- 950
- 970
- none of these
- Find the sum of total number of employees working in E and F in all the years together.
- 14200
- 16200
- 17200
- 15200
- none of these
Click Here for More Quantitative Aptitude Questions


appraisal of IBPS GUIDE
Sir this wonderful examples to increase one’s speed. I request you to make its user interface like testbook and See appraisal of
thanks for your suggestions..
please attach answer key also and enhance user interface like real exam. Quality of que is nice thank u.
sure will we