


Dear Readers, IBPS RRB is conducting Online Examination for the recruitment of Assistant. To enrich your preparation here we have providing new series of Data Interpretation – Quantitative Aptitude Questions. Candidates those who are appearing in RRB Assistant Mains Exams can practice these Quantitative Aptitude average questions daily and make your preparation effective.
[WpProQuiz 3332]Click “Start Quiz” to attend these Questions and view Solutions
Directions (1 – 5): Study the following table carefully and answer the given questions.
Following pie chart 1 shows the total number of newspaper readers from 6 different cities in the year 2016 and pie chart 2 shows the total number of newspaper readers from 6 different cities in the year 2017.
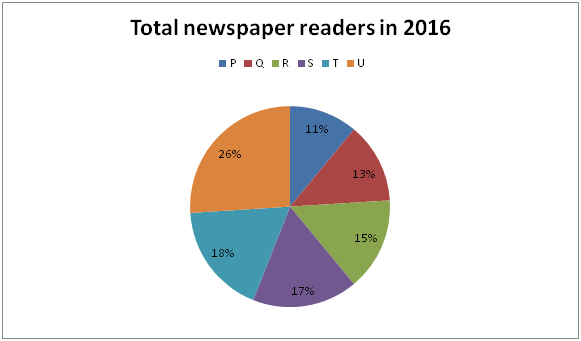
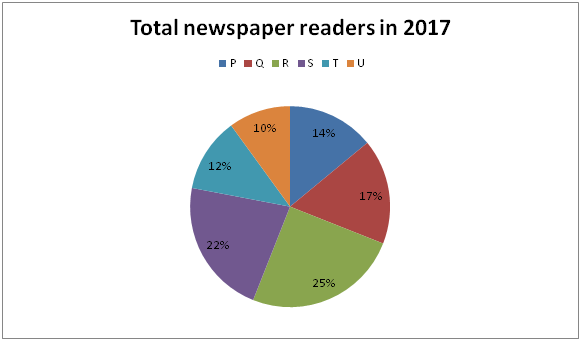
1) If the total number of readers from city Q in the year 2016 and 2017 is 65000 and 102000 respectively, then find the difference between the total number of newspaper readers from city S in the year 2016 to that of total number of newspaper readers from city R in the year 2017?
a) 72000
b) 65000
c) 68000
d) 75000
e) None of these
2) If the ratio of the number of readers from state R in the year 2016 to that in 2017 is 3 : 5, then find the ratio between the total number of readers from all states together in year 2016 to that in 2017?
a) 2 : 3
b) 3 : 4
c) 1 : 2
d) 1 : 1
e) None of these
3) If the total number of readers from state S in the year 2016 and that from state T in the year 2017 are 93500 and 105000 respectively, then find the total number of readers from state Q in the year 2016 and 2017 together?
a) 215600
b) 185900
c) 220250
d) 257500
e) None of these
4) If the total number of readers from all the six states together in 2016 and 2017 are 5.75 lakhs and 7.5 lakhs respectively, then find the difference between the total number of readers from state S and state U together in the year 2016 to that in the year 2017?
a) 7250
b) 8100
c) 8500
d) 7450
e) None of these
5) If the difference between the number of readers from state R and U in 2016 is 72600 and the number of readers in state R in the year 2017 has increased by 45 % as compared to 2016, then find the total number of readers of state S in 2017?
a) 105472
b) 117836
c) 156230
d) 126324
e) None of these
Directions (6 – 10): Study the following information carefully and answer the given questions.
The following table shows the number of pens (In lakhs) produced and sold by three different companies in 5 different years.
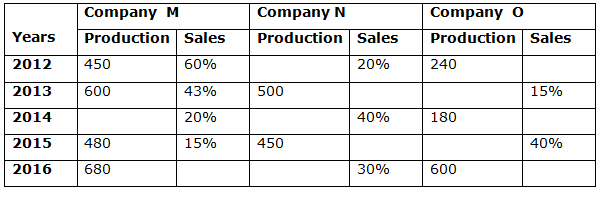
6) If the total number of pens sold by company M and N in the year 2013 is 400 and the number of pens sold by company N in 2014 is 200 more than pens sold by the same company in 2013, then find the number of pens produced by company N in 2014?
a) 730 lakhs
b) 400 lakhs
c) 855 lakhs
d) 615 lakhs
e) 550 lakhs
7) If the ratio of the number of pens sold by company M in 2015 to that in 2016 is 8: 17, then find the percentage of pens were sold by company M in 2016?
a) 18 %
b) 22.5 %
c) 25 %
d) 30.5 %
e) 35 %
8) If company O produced ‘x’ number of pens in 2013 and ‘x + 200’ number of pens in 2015 and the total number of pens sold by company O in these years is 630 lakhs, then find the number of pens were sold by O in 2015?
a) 200 lakhs
b) 250 lakhs
c) 480 lakhs
d) 300 lakhs
e) 350 lakhs
9) Company N has produced 900 lakhs pens in 2016 and the number of pens sold by the same company in 2013 is 10 % more than number of pens sold by the company in 2016, then find number of pens produced by the same company in 2014 if the number of pens sold by company N in 2013 and 2014 is in the ratio of 9 : 8?
a) 200 lakhs
b) 400 lakhs
c) 480 lakhs
d) 660 lakhs
e) 350 lakhs
10) If the average number of pens sold by company M in 2012, 2013 and 2014 are 200 lakhs, then the production of company M in 2014 is what percentage of the total production of company N in 2015?
a) 90 %
b) 80 %
c) 75 %
d) 65 %
e) 55 %
Answers :
1). Answer: b)
The total number of readers from city Q in the year 2016 = 65000
(13/100)*Total number of readers in 2016 = 65000
Total number of readers in 2016 = 65000*(100/13) = 500000
Total number of newspaper readers from city S in the year 2016
= > 500000*(17/100) = 85000
The total number of readers from city Q in the year 2017 = 102000
(17/100)*Total number of readers in 2017 = 102000
Total number of readers in 2017 = 102000*(100/17) = 600000
Total number of newspaper readers from city R in the year 2017
= > 600000*(25/100) = 150000
Required difference = 150000 – 85000 = 65000
2). Answer: d)
The ratio of the total number of readers from state R in the year 2016 to that in 2017 = 3 : 5 (3x, 5x)
The total number of readers from state R in the year 2016
(15/100)*Total number of readers in 2016 = 3x
Total number of readers in 2016 = 3x*(100/15) = 20x
The total number of readers from state R in the year 2017
(25/100)* Total number of readers in 2017 = 5x
Total number of readers in 2017 = 5x*(100/25) = 20x
Required ratio = 20x : 20x = 1 : 1
3). Answer: c)
The total number of readers from state S in the year 2016 = 93500
(17/100)*Total number of readers in 2016 = 93500
Total number of readers in 2016 = 93500*(100/17) = 550000
The total number of readers from state Q in the year 2016
= > 550000*(13/100) = 71500
The total number of readers from state T in the year 2017 = 105000
(12/100)*Total number of readers in 2017 = 105000
Total number of readers in 2017 = 105000*(100/12) = 875000
The total number of readers from state Q in the year 2017
= > 875000*(17/100) = 148750
Required total = 148750 + 71500 = 220250
4). Answer: a)
The total number of readers from all the six states together in 2016 = 5.75 lakhs
The total number of readers from all the six states together in 2017 = 7.5 lakhs
The total number of readers from state S and state U together in the year 2016
= > 575000*(43/100) = 247250
The total number of readers from state S and state U together in the year 2017
= > 750000*(32/100) = 240000
Required difference = 247250 – 240000 = 7250
5). Answer: d)
The difference between the number of readers from state R and U in 2016
= > 72600
(11/100)*Total number of readers in 2016 = 72600
Total number of readers in 2016 = 72600*(100/11) = 660000
The number of readers in state R in the year 2017
= > 660000*(15/100)*(145/100) = 143550
(25/100)*Total number of readers in 2017 = 143550
Total number of readers in 2017 = 143550*(100/25) = 574200
Total number of readers of state S in 2017 = 574200*(22/100) = 126324
6). Answer: c)
Number of pen sold by company N in 2013
= > 400 – 600*(43/100)
= > 400 – 258 = 142 lakhs
Number of pen sold company N in 2014 = 142 + 200 = 342 lakhs
Number of pen produced by company N in 2014
= > 342*100/40 = 855 lakhs
7). Answer: b)
Number of pens sold by company M in 2015
= > 480*15/100= 72 lakhs
Number of pens sold by company M in 2016
= > 72*17/8 = 153 lakhs
Required percentage = (153/680)*100 = 22.5 %
8). Answer: c)
Number of pens sold in 2013
= > x*15/100 + (x+200)*40/100 = 630
= > 15x/100 + 40x/100 + 80 = 630
= > (15x+ 40x)/100 = 630 – 80
= > 55x = 550*100
= > x = 1000 lakhs
Number of pens sold in 2015 = (1000+200)*(40/100) = 480 lakhs
9). Answer: d)
Number of pens sold by company N in 2016 = 900*(30/100) = 270 lakhs
Number of pens sold by company N in 2013 = 270*(110/100) = 297 lakhs
Number of pens sold by company N in 2014 = 297*8/9 = 264 lakhs
Number of pens produced by company N in 2014
= > 264*(100/40) = 660 lakhs
10). Answer: b)
Total pens sold by company M in 2012, 2013 and 2014 together
= > 200*3= 600 lakhs
Number of pens sold by company M in 2014
= > 600 – [(60/100)*450 + (43/100)*600]
= > 600 – 270 – 258 = 72 lakhs
Number of pens produced by company M in 2014 = 72*(100/20) = 360 lakhs
Required percentage = (360/450)*100 = 80%
Daily Practice Test Schedule | Good Luck
| Topic | Daily Publishing Time |
| Daily News Papers & Editorials | 8.00 AM |
| Current Affairs Quiz | 9.00 AM |
| Quantitative Aptitude “20-20” | 11.00 AM |
| Vocabulary (Based on The Hindu) | 12.00 PM |
| General Awareness “20-20” | 1.00 PM |
| English Language “20-20” | 2.00 PM |
| Reasoning Puzzles & Seating | 4.00 PM |
| Daily Current Affairs Updates | 5.00 PM |
| Data Interpretation / Application Sums (Topic Wise) | 6.00 PM |
| Reasoning Ability “20-20” | 7.00 PM |
| English Language (New Pattern Questions) | 8.00 PM |
Click Here for More Quantitative Aptitude Questions


