


Quantitative Aptitude Questions (Data Interpretation) for SBI Clerk 2018 Day-5:
Dear Readers, SBI is conducting Online preliminary Examination for the recruitment of Clerical Cadre. preliminary Examination of SBI Clerk was scheduled from March 2018. To enrich your preparation here we have providing new series of Data Interpretation – Quantitative Aptitude Questions. Candidates those who are appearing in SBI Clerk Prelims Exam can practice these Quantitative Aptitude average questions daily and make your preparation effective.
Click “Start Quiz” to attend these Questions and view Solutions
Directions(Q 1-5) The Graph above shows value of import and export of goods by a Seller:-
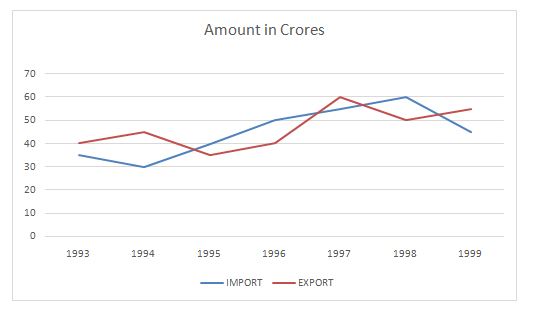
- During which year the percentage rise/ fall in imports from the previous year is the lowest?
- 1994
- 1998
- 1997
- 1999
- None of These
- By how much percentage exports in the given years is more than the import during all the years?
- 2.16
- 3.32
- 3
- 3.17
- None of these
- In which of the following pairs of years the total import is equal to total export in the same pairs of years?
- 1998-1999
- 1996-1997
- 1993-1998
- Can’t be determined
- None of These
- The total exports in the years 1995,1996 and 1999 together are what percent of the total import during the same period?
- 107.41
- 93.33
- 93.76
- 98.90
- None of These
- Which of the following pairs of years and the per cent increase in the export over the previous year is correctly matched?
- 1996-14.29
- 1997-10
- 1995-33.33
- 1994 – 11.5
- None of These
Directions (Q. 6-10) Study the following graph carefully and answer the given questions.
The following graph shows the ratio of import to export of three different countries over the years.
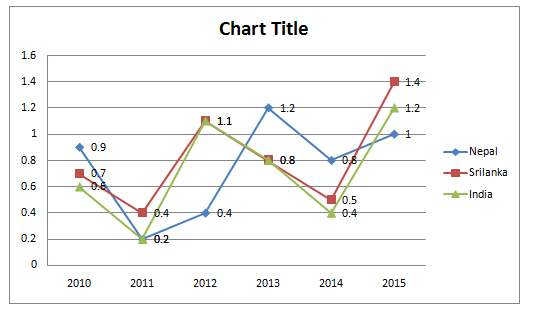
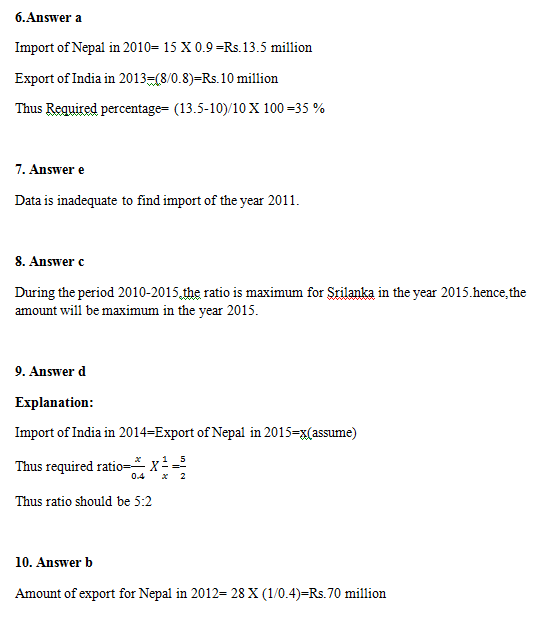
- If the import of India was Rs 8 million in 2013 and the export of Nepal in 2010 was 3/2 times of import of India in 2013 ,by what percent was the import of Nepal in 2010 more than the export of India in 2013.
- 35%
- 50%
- 40%
- 4%
- 20%
- If the amount of export of Srilanka in 2011 was Rs 9 million, find the amount of total import of the same year.
- Rs.1.2 million
- Rs.1.8 million
- Rs.0.52 million
- Rs.2.1 million
- cannot be determined
- In which of the following years the amount of import the maximum for Srilanka? (Assume that the amount of export is same for each year)
- 2013
- 2011
- 2015
- 2014
- 2010
- If the amount of import for India in the year 2014 and the amount of export for Nepal in 2015 respectively be the same, then find the ratio of the amount of export in 2014 for India to the amount of import in 2015 for Nepal.
- 2:5
- 16:5
- 5:16
- 5:2
- 8:6
- If the amount of import for Nepal in 2012 was 28 million,then find the amount of export for Nepal in the same year.
- 30 million.
- 70 million
- 40 million
- 50 million
- 55 million
Answers:
Directions(Q 1-5):
- Answer: b
1998
It can easily understood from the given figure
- Answer: d
Total imports in the given years= 315 crores
Total exports in the given years= 325 crores
Percentage by which export is more = 10/315* 100= 3.17%
- Answer: a
1998- 1999
It can be determined by going through the graph
- Answer: e
Total import in the given years= 130 crores
Total Exports in the given tears = 135
Required Percentage= 130*100/135= 96.29%
- Answer: a
If we calculate approximate value then only in the year 1996 is close
So,
In 1996, % increase in export= 5/35*100= 100/7= 14.29%
Directions (Q. 6-10) :
Click Here for More Quantitative Aptitude Questions


