


Quantitative Aptitude Questions (Data Interpretation) for SBI Clerk 2018 Day-10:
Dear Readers, SBI is conducting Online preliminary Examination for the recruitment of Clerical Cadre. preliminary Examination of SBI Clerk was scheduled from March 2018. To enrich your preparation here we have providing new series of Data Interpretation – Quantitative Aptitude Questions. Candidates those who are appearing in SBI Clerk Prelims Exam can practice these Quantitative Aptitude average questions daily and make your preparation effective.
[WpProQuiz 1211]
Click “Start Quiz” to attend these Questions and view Solutions
Directions (Q. 1-5): Study the following information carefully and answer the questions given below:
The following bar graph represents number of males and females working in six different companies.
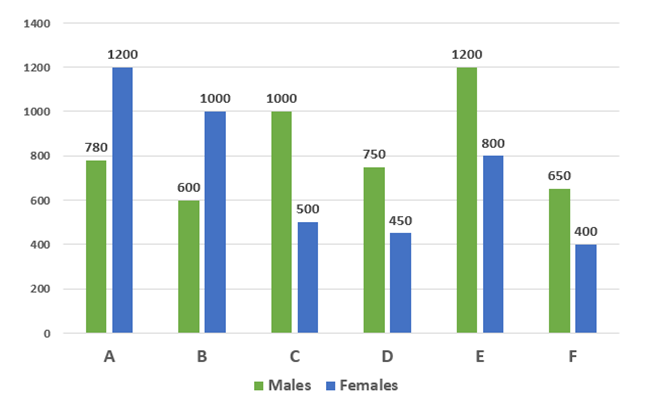
- Number of males in company A is what percent more than the number of females in company D?
- 68.56%
- 73.33%
- 72.13%
- 82.25%
- none of these
- Find the difference between total number of males and total number of females in all the companies.
- 590
- 650
- 710
- 630
- none of these
- Find the ratio of total number of females working in company A, B and C together and the total number of males working in company D,E and F together.
- 26:25
- 27:26
- 25:24
- 24:23
- none of these
- Total number of males of company B, C and E together are what percent of total number of females of company A, D and F together?
- 153.58%
- 163.58%
- 136.58%
- 158.36%
- none of these
- Total number of employees of company A and B together is what percent more than the total number of employees of company C and D together?
- 41.35%
- 32.59%
- 35.68%
- 48.98%
- none of these
Directions (Q. 6 – 10): Study the following information carefully and answer the questions given below:
The following table represents number of employees (managers and workers) working in a company in six different years.
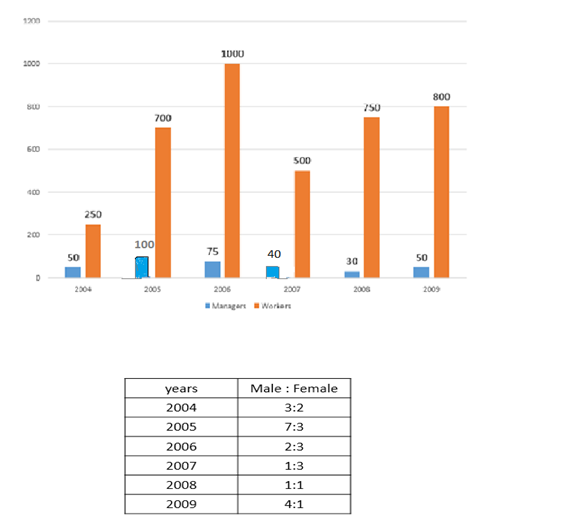
- Find the total number of female employees of the company over all the years.
- 1658
- 1852
- 1970
- 1540
- none of these
- Total number of workers is what percent more than the total number of managers throughout all the years?
- 1490.3%
- 1509.42%
- 1059.42%
- 1904.43%
- none of these
- If in 2004, out of total male employees, 3/4th are workers, find the ratio of male workers in 2004 to the total number of female employees in 2009.
- 13:15
- 14:25
- 34:27
- 27:34
- none of these
- Number of workers in 2008 is what percent of number of workers in 2005?
- 170.14%
- 117.41%
- 107.14%
- 170.41%
- None of these
- Find the difference between the number of female employees in 2006 and number of female employees in 2008.
- 145
- 255
- 146
- 256
- None of these
Answers with Explanation:
Directions (Q. 1-5):
- Answer: b
required percentage = (780 – 450)/450 x 100
= 73.33%
- Answer: d
total number of males = 780 + 600 + 1000 + 750 + 1200 + 650 = 4980
total number of females = 1200 + 1000 + 500 + 450 + 800 + 400 = 4350
required difference = 630
- Answer: b
total number of females working in company A, B and C together = 1200 + 1000 + 500 = 2700
total number of males working in company D, E and F together = 750 + 1200 + 650 = 2600
required ratio = 2700/2600 = 27:26
- Answer: c
total number of males of company B,C and E together = 600 + 1000 + 1200 = 2800
total number of females of company A,D and F together = 1200 + 450 + 400 = 2050
required percentage = 2800/2050 x 100 = 136.58%
- Answer: b
total number of employees of company A and B together = 780 + 1200 + 600 + 1000 = 3580
total number of employees of company C and D together = 1000 + 500 + 750 + 450 = 2700
required percentage = (3580 – 2700)/2700 x 100 = 32.59%
Directions (Q. 6 – 10):
- Answer: c
Total number of employees in 2004 = 50 + 250 = 300
Females in 2004 = 2/5 x 300 = 120
Total number of employees in 2005 = 100 + 700 = 800
Females in 2005 = 3/10 x 800 = 240
Total number of employees in 2006 = 75 + 1000 = 1075
Females in 2006 = 3/5 x 1075 = 645
Total number of employees in 2007 = 40 + 500 = 540
Females in 2007 = 3/4 x 540 = 405
Total number of employees in 2008 = 30 + 750 = 780
Females in 2008 = 1/2 x 780 = 390
Total number of employees in 2009 = 50 + 800 = 850
Females in 2009 = 1/5 x 850 = 170
Total number of female employees = 120 + 240 + 645 + 405 + 390 + 170 = 1970
- Answer: c
Total number of workers = 250 + 700 + 1000 + 500 + 750 + 800 = 4000
Total number of managers = 50 + 100 + 75 + 40 + 30 + 50 = 345
Required percentage = (4000 – 345)/345 x 100 = 3655/345 x 100 = 1059.42%
- Answer: d
Number of male workers in 2004 = 3/4 x 3/5 x (50 + 250) = 135
Number of female employees in 2009 = 1/5 x (50 + 800) = 170
Required ratio = 27 : 34
- Answer: c
Required percentage = 750/700 x 100 = 107.14%
- Answer: b
Female employees in 2006 = 3/5 x (1000 + 75) = 3/5 x 1075 = 645
Female employees in 2008 = 1/2 x (750 + 30) = 1/2 x 780 = 390
Required difference = 645 – 390 = 255
Click Here for More Quantitative Aptitude Questions


Leave a Reply