


Radar Graph DI Questions PDF For Bank Exams: Dear Aspirants, Our IBPS Guide team is providing a new series of Quants Questions for bank exams so the aspirants can practice it on a daily basis. These questions are framed by our skilled experts after understanding your needs thoroughly. Aspirants can practice these new series of questions daily to familiarize themselves with the exact exam pattern and make their preparation effective. The Radar Graph DI Questions PDF is attached here for the bank exam preparation. Aspirants who are effectively preparing for the bank PO and clerk exam shall utilize this Radar Graph DI Questions PDF to enhance their preparation level. As we all know the quantitative aptitude section is the most important section of all the bank exams. In the aptitude section, Radar Graph DI Questions play a major role. It helps us to maximize our marks in the aptitude section of the bank exams. So every aspirant should be proficient with the Radar Graph DI questions which are frequently asked in most of the bank PO and Clerk examinations. We have added the Radar Graph DI Questions PDF for SBI PO to this article. Candidates shall download this Radar Graph DI Questions PDF for SBI PO and prepare well for the upcoming bank exams. The questions in this Radar Graph DI Questions PDF for bank exams are curated by our experts by analyzing the current trend and previous year’s bank exam question papers. Candidates are advised to kindly download our Radar Graph DI PDF for bank PO, Clerk Prelims, and Mains and enhance their knowledge as well.
Download Radar Graph DI Questions PDF For Bank Exams
The Radar Graph DI Questions PDF For Bank Exams download link is provided below. Candidates can download the Radar Graph DI Questions PDF by clicking the link. The prelims and mains exams of most of the bank exams contain Radar Graph DI questions as it is an important topic. We can easily score 5 marks in the Radar Graph DI topic if we practice with the Radar Graph DI Questions PDF for bank exams. So download this Radar Graph DI Questions PDF for bank exams as soon as possible to prepare effectively for your upcoming bank examinations.
Download Radar Graph DI Questions PDF
Radar Graph DI Questions And Answers
The Radar Graph DI PDF Questions PDF contains all the levels and types of Radar Graph DI questions with answers and detailed explanations. Utilize this Radar Graph DI questions and answers pdf for the bank Prelims exam and Radar Graph DI questions and answers pdf for bank mains to improve your speed and accuracy while solving the Radar Graph DI questions in real exams. You may experience all the techniques and tricks to solve the questions while practicing with the Radar Graph DI questions and answers pdf for bank exams. Aspirants who have quant as their weak section must take up this PDF for bank exams and practice with this regularly. Candidates can start their effective preparation by exploiting this Radar Graph DI questions pdf for bank exams.
Start Quiz
Direction (1-5): Study the following graph carefully and answer the questions given below:
The given radar graph shows the number of students (in thousands) who opted for three different specializations during the given five years in the MBA exam
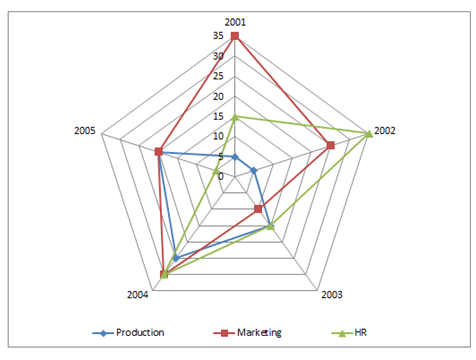
1) What is the respective ratio between the number of students who opted for Marketing in the years 2002 and 2004 together to the number of students who opted for Production in the year 2001 and 2005 together?
A.11: 5
B.5: 7
C.5:12
D.7: 12
E.None of these
2) If the total number of students in the given exam in the year 2003 was 455030, the total number of students who opted for the given three specialization were approximately what percent of the total students?
A.5
B.9
C.17
D.22
E.24
3) What is the total number of students who opted for Production and who opted for HR in the years 2002, 2003 and 2005 together?
A.45000
B.90020
C.95000
D.24500
E.None of these
4) Out of the total number of students who opted for the given three specializations, in the year 2005, 38% were girls. How many boys opted for the given three specialization in the same year?
A.21500
B.42100
C.44510
D.21000
E.27900
5) The total number of students who opted for HR in the years 2001 and 2004 together are approximately what percent of the total number of students who opted for all three posts in the same years?
A.34
B.22
C.24
D.32
E.28
Direction (6-10): Study the following information carefully and answer the questions given below.
The given radar graph shows two different vaccines given to the number of children(in ‘00s) in five different states.
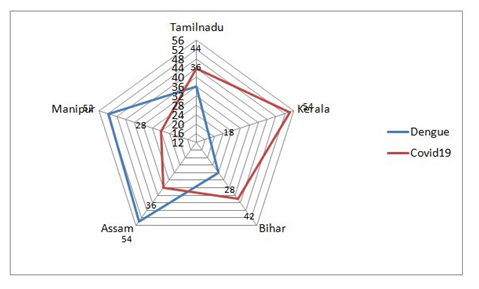
6) What is the ratio of the Dengue vaccine given to the number of children in Tamilnadu and Bihar together to the Covid19 vaccine given to the number of children in Assam and Kerala?
A.16:23
B.32:45
C.31:44
D.16:19
E.None of these
7) What is the difference between the total number of children had injected Dengue and Covid19 vaccines in Bihar and Manipur together and the number of children had injected Covid19 vaccine in Tamilnadu and Assam together?
A.7000
B.6000
C.9000
D.8000
E.5000
8) The number of children had injected Covid19 vaccine in Kerala and Manipur together is approximately what percent of the number of children had injected Covid19 vaccine in all the states together?
A.35%
B.38%
C.40%
D.43%
E.46%
9) What is the average number of children had injected Dengue vaccine in all the states together?
A.3250
B.3380
C.3560
D.3760
E.3830
10) The number of children had injected Dengue vaccine in Delhi is 35% more than the number of children had injected Covid19 vaccine in Bihar and the number of children had injected Covid19 vaccine in Delhi is 25% more than the number of children had injected Dengue vaccine in Tamilnadu. Find the number of children had injected Dengue and Covid19 vaccine in Delhi?
A.10170
B.10190
C.11080
D.11100
E.11050
Try Data Interpretation Questions For Online Mock Test
Answers :
1) Answer: A
Required Ratio
= (25 + 30): (5 + 20)
= 55: 25
= 11: 5
2) Answer: B
Required Percentage
= {(15 + 10 + 15) × 1000} / 455030 × 100
= {(40000)/455030} × 100
= 8.79
= 9% Approximately
3) Answer: C
Required total number of students
= (5 + 35 + 15 + 15 + 20 + 5) × 1000
= 95000
4) Answer: E
In 2005
Total number of girls = (20 + 20 + 5) × 38/100 × 1000
= 1710000 / 100
= 17100
Total number of boys = 45000 – 17100 = 27900
5) Answer: D
Required percentage
= {(15000 + 30000) / (5000 + 35000 + 15000 + 25000 + 30000 + 30000)} × 100
= 4500000/140000
= 32.14
= 32% Approximately
6) Answer: B
Required ratio = (3600 + 2800):(3600 + 5400)
= 6400:9000
= 32:45
7) Answer: A
Required difference = (2800 + 4200 + 5200 + 2800) – (4400 + 3600)
= 15000 – 8000
= 7000
8) Answer: C
Required percentage = (5400 + 2800)/(4400 + 5400 + 4200 + 3600 + 2800) * 100
= (8200/20400) * 100
= 40%
9) Answer: D
Required average = (3600 + 1800 + 2800 + 5400 + 5200)/5
= 18800/5
= 3760
10) Answer: A
Required total = 135/100 * 4200 + 3600 * 125/100
= 5670 + 4500
= 10170
Download Radar Graph Questions for SBI/ IBPS PO Prelims Exam PDF
Try IBPS PO Free Online Mock Test
Try SBI PO Free Online Mock Test


Aptitude questions and answers for student to practice previous year exams, interview, competitive examination and entrance exams