


Dear Aspirants, Our IBPS Guide team is providing new series of Quants Questions for IBPS PO Prelims 2023 so the aspirants can practice it on a daily basis. These questions are framed by our skilled experts after understanding your needs thoroughly. Aspirants can practice these new series questions daily to familiarize with the exact exam pattern and make your preparation effective.
Start Quiz
Directions (1-5): Study the following information carefully and answer the questions given below.
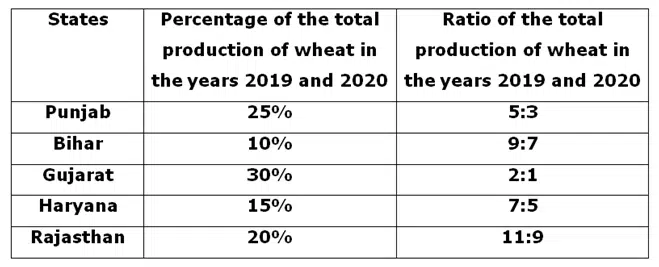
The given table chart shows the percentage distribution of the total production of wheat in two different years i.e. 2019 and 2020 from five different states (Punjab, Bihar, Gujarat, Haryana and Rajasthan) and also given the ratio of the total production of wheat in the years 2019 and 2020 from five different states.
Note: The total production of wheat in the years 2019 and 2020 from Bihar is 800.
1) If the ratio of the total production of wheat in the year 2020 from Punjab and Uttar Pradesh 5:3 and then find the average production of wheat in the year 2020 from Uttar Pradesh and Bihar together?
a) 440
b) 420
c) 460
d) 400
e) None of these
2) Find the ratio of the total production of wheat in the year 2019 from Gujarat to the total production of wheat in the year 2019 from Rajasthan?
a) 20:11
b) 7:9
c) 5:4
d) 12:7
e) None of these
3) The total production of wheat in the year 2020 from Haryana is how much percent more/less than the total production of wheat in the year 2019 from Punjab?
a) 40% less
b) 60% less
c) 20% less
d) 50% less
e) None of these
4) If the average total production of wheat in the years 2019, 2020 and 2021 from Rajasthan is 600 and then find 37.5% of the total production of wheat in the year 2021 from Rajasthan?
a) 45
b) 60
c) 75
d) 35
e) None of these
5) Find the difference between 66.66% of the total production of wheat in the year 2020 from Rajasthan and 6.25% of the total production of wheat in the year 2020 from Gujarat?
a) 490
b) 470
c) 410
d) 430
e) None of these
Direction (6-10): Study the following information carefully and answer the questions given below.
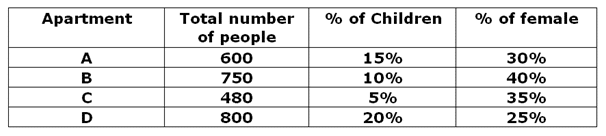
The given table shows the total number of people lives in four different apartments i.e, A, B, C and D.
Note: Total number of people= Number of children + Number of females + Number of males
6) The number of males in apartment B is approximately what percent of the number of females in apartment C?
a) 220%
b) 223%
c) 235%
d) 240%
e) 250%
7) Find the difference between the total number of children in Apartment A and D together and the number of males in Apartment B?
a) 100
b) 200
c) 125
d) 135
e) None of these
8) Find the total number of females in all the apartments together?
a) 880
b) 838
c) 840
d) 848
e) None of these
9) The total number of children and females in Apartment C is how much more or less than the number of males in apartment C?
a) 96 less
b) 96 more
c) 86 less
d) 86 more
e) None of these
10) Find the ratio of the total number of males in apartment B&C together to total number of people in apartment D?
a) 667:800
b) 663:800
c) 669:800
d) 661:800
e) None of these
Try Data Interpretation Questions Online Mock Test
Answers :
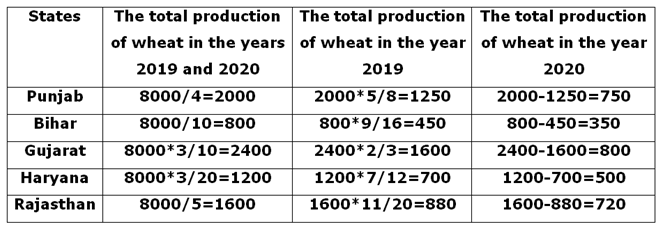
Directions (1-5) :
Let the total production of wheat in the years 2019 and 2020 from five different states =100x
The total production of wheat in the years 2019 and 2020 from Bihar=100x/10=10x
The total production of wheat in the year 2019 and 2020 from five different states =100x*800/10=8000
1) Answer: D
The total production of wheat in the year 2020 from Uttar Pradesh=750/5*3=450
The total production of wheat in the year 2020 from Uttar Pradesh and Bihar=450+350 =800
Required average=800/2=400
2) Answer: A
Required ratio=1600:880=20:11
3) Answer: B
Required percentage=(500-1250)/1250*100=-750/1250*100=60% less
4) Answer: C
The total production of wheat in the years 2019, 2020 and 2021 from Rajasthan=600*3 =1800
The total production of wheat in the year 2021 from Rajasthan=1800-1600=200
Required value=200*3/8=75
5) Answer: D
Required difference=720*2/3-800/16=480-50=430
Directions (6-10) :
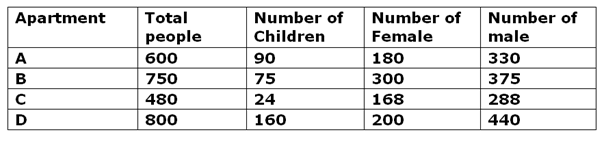
Apartment A:
The number of female = 30% of 600 = 180
The number of children = 15% of 600 =90
The number of male = (100%- 15%-30%) = 55% of 600 = 330
Similarly we can find for all other apartments
6) Answer: B
Required percentage = (375/168) * 100 = 223%
7) Answer: C
Required difference = (90+160) – 375 = 250 – 375 = 125
8) Answer: D
Total number of females = 180 + 300 + 168 + 200 = 848
9) Answer: A
Required difference = (24+168) – 288 = 192 – 288 = 96 less
10) Answer: B
Required Ratio = (375+288) : 800 = 663 : 800
Start Quiz
Directions (11-15): Study the following information carefully and answer the questions given below.
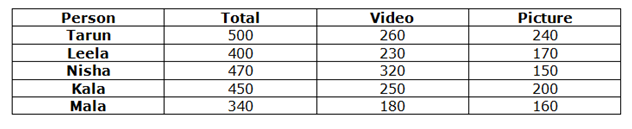
The given table shows the total number of videos and pictures liked by five different persons namely Tarun, Leela, Nisha, Kala and Mala and also given the ratio of the number of videos and pictures liked by these five persons.
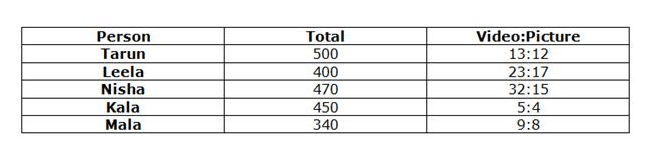
11) What is the average number of pictures liked by Nisha, Kala and Mala?
A.130
B.140
C.150
D.160
E.170
12) The number of videos liked by Leela is what percent of the number of pictures liked by Mala?
A.143.75%
B.134.56%
C.138.91%
D.141.72%
E.147.83%
13) What is the ratio of the number of Videos liked by Tarun and Mala together to the number of pictures liked by Leela and Mala together?
A.3:2
B.5:4
C.6:5
D.4:3
E.2:1
14) What is the difference between the total number of videos and pictures together liked by Tarun and the number of pictures liked by Kala?
A.270
B.300
C.320
D.340
E.360
15) What is the average number of videos liked by all the five given persons together?
A.248
B.245
C.252
D.254
E.242
Directions (16-20): Study the following information carefully and answer the questions given below.
The given table shows the number of or percentage of students in three different departments namely CSE, EEE and ECE in four different colleges namely A, B, C and D.
Note: Total number of students= Number of CSE students + Number of EEE students + Number of ECE students
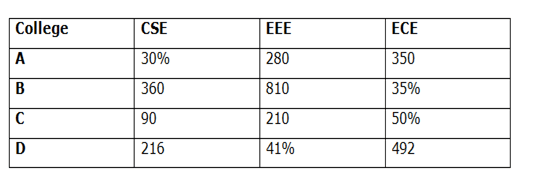
16) What is the sum of the number of students in CSE department in college A and C?
A.320
B.360
C.390
D.420
E.450
17) What is the ratio of the number of CSE students in B to the number of ECE students in C?
A.5:4
B.3:2
C.6:5
D.4:5
E.1:2
18) What percentage of ECE department students in A?
A.38.89%
B.39.92%
C.40.09%
D.41.56%
E.43.32%
19) What is the average number of EEE students in all the colleges together?
A.456
B.464
C.450
D.448
E.444
20) What is the difference between the total number of ECE students in B and C together and the total number of students in A and D together?
A.1130
B.1150
C.1170
D.1190
E.None of these
Try Data Interpretation Questions Online Mock Test
Answers :
Directions (11-15) :
For Tarun,
Total number of videos and pictures liked by Tarun=500
Total number of videos liked by Tarun=500*13/25=260
Total number of pictures liked by Tarun=500*12/25=240
Similarly, we can find other values for other persons also.
11) Answer: E
Required average = (150 + 200 + 160)/3= 510/3
= 170
12) Answer: A
Required percentage = 230/160 * 100
= 143.75%
13) Answer: D
Required ratio = (260 + 180):(170 + 160)
= 440:330
= 4:3
14) Answer: B
Required difference = 500 – 200 = 300
15) Answer: A
Required average = (260 + 230 + 320 + 250 + 180)/5
= 1240/5 = 248
16) Answer: B
Number of CSE students in A = 30/70 * (280 + 350) = 270
Required total = 270 + 90
= 360
17) Answer: C
Number of ECE students in C = 50/50 * (90 + 210) = 300
Required ratio = 360:300
= 6:5
18) Answer: A
Number of CSE students in A = 30/70 * (280 + 350) = 270
Total number of students in A = 270 + 280 + 350 = 900
Required percentage = 350/900 * 100
= 38.89%
19) Answer: D
Number of EEE students in D = 41/59 * (216 + 492)
= 492
Required average = (492 + 210 + 810 + 280)/4
= 1792/4
= 448
20) Answer: C
Number of ECE students in B = 35/65 * (810 + 360) = 630
Number of ECE students in C = 50/50 * (90 + 210) = 300
Number of EEE students in D = 41/59 * (216 + 492)
= 492
Number of CSE students in A = 30/70 * (280 + 350) = 270
Total number of students in A = 270 + 280 + 350 = 900
Total number of students in D = 216 + 492 + 492 = 1200
Required difference = (1200 + 900) – (630 + 300)
= 1170
Start Quiz
Directions (21-25): Study the following information carefully and answer the questions given below.
The given table shows the number of female employees working in five different offices i.e. A, B, C, D and E and also given the ratio of the number of male to female employees working in these five companies.
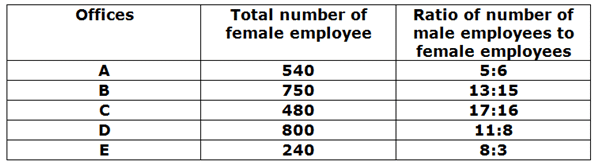
21) Find the ratio of the total number of male employees working in company A & B together to the total number of female employees working in Company D & E together?
A.52:55
B.55:52
C.55:57
D.57:55
E.None of these
22) The number of males working in company C is what percent of the number of females working in Company B?
A.100%
B.70%
C.68%
D.88%
E.None of these
23) Find the difference between the total number of males working in company A and B together and the total number of males working in company D?
A.50
B.100
C.200
D.0
E.None of these
24) The number of males working in company D is what percent more than the number of females working in company D?
A.15%
B.10%
C.25%
D.36%
E.None of these
25) Find the average number of males working in all company together?
A.660
B.670
C.665
D.655
E.None of these
Directions (26-30): Study the following information carefully and answer the questions given below.
The given table shows the percentage distribution of the production of shoes out of the total number of shoes manufactured by all the companies together and also given the ratio of the number of Nike and adidas shoes manufactured by respective companies. Total number of shoes manufactured by all companies together is 40000. Each company manufactured only two brands of shoes i.e. Nike and Adidas.
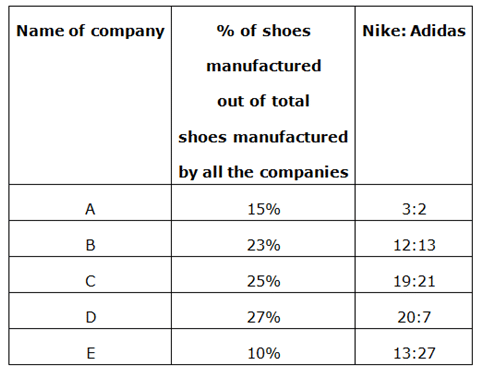
26) Number of Adidas shoes manufactured by company A is what percentage of the number of Nike shoes manufactured by company D?
A.30%
B.25%
C.20%
D.15%
E.18%
27) Find the sum of the number of Nike shoes manufactured by B and the number of Adidas shoes manufactured by C?
A.9656
B.9676
C.9696
D.9896
E.9666
28) Find the average of the number of Nike shoes manufactured by all companies together?
A.4423.2
B.4433.2
C.4413.2
D.4444.2
E.None of these
29) Find the Ratio of the number of Adidas shoes manufactured by company E to the number of Nike shoes manufactured by company A.
A.4:3
B.3:4
C.2:3
D.5:4
E.None of these
30) Find the average of the number of Adidas shoes manufactured by Company B, D and E together.
A.3428
B.3418
C.3438
D.3448
E.None of these
Try Data Interpretation Questions Online Mock Test
Answers :
Directions (21-25) :
Company A:
Number of females = 540
Number of males = (5/6)*540 = 450
Similarly, we can find for other companies also.
21) Answer: B
Required ratio = (450+650) : (800+240) = 1100 : 1040 = 55:52
22) Answer: C
Required percent = 510/750 * 100 = 68%
23) Answer: D
Required difference =(450+650) – 1100 = 1100 – 1100 = 0
24) Answer: E
Required percentage = (1100 – 800)/800 * 100 = (300/800)*100 = 37.5%
25) Answer: B
Required average = (450+650+510+1100+640)/5 = 670
Directions (26-30) :
Company A:
Total number of shoes manufactured =15*40000/100=6000
Number of Nike shoes manufactured=6000/5*3=3600
Number of Adidas shoes manufactured =6000*2/5=2400
Similarly, we can find other companies values also.
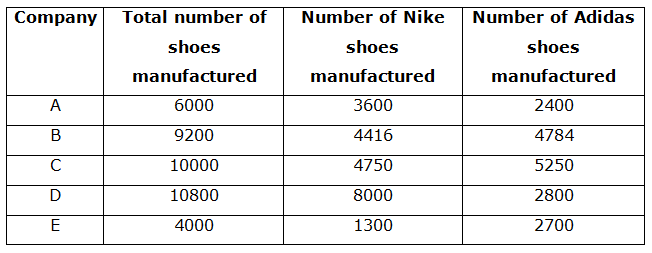
26) Answer: A
Required % = 2400/8000 x 100 = 30%
27) Answer: E
Required sum = 4416 + 5250 = 9666
28) Answer: C
Required average = (3600 + 4416 + 4750 + 8000 + 1300)/5 = 4413.2
29) Answer: B
Required ratio = 2700:3600 = 3:4
30) Answer: A
Required average = (4784 + 2800 + 2700) / 3 = 3428
Start Quiz
Directions (31-35): Study the following information carefully and answer the questions given below.
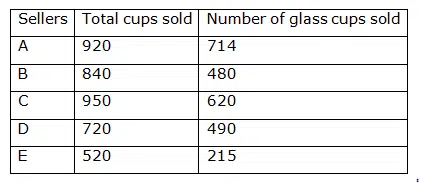
The given table shows the total number of cups sold (plastic and glass) and also given the number of glass cups sold by the 5 different sellers namely A, B, C, D and E.
31) 10% of the glass cups and 20% of the plastic cups sold by seller C are defective pieces. Find the number of non-defective cups sold by seller C.
A.722
B.780
C.822
D.890
E.None of these
32) Number of red colour plastic cups sold by seller D is 80 percent less than the number of glass cups sold by seller B. Find the number of red colour plastic cups sold by seller D.
A.78
B.90
C.96
D.67
E.None of these
33) If the ratio of the number of black cups to white cups sold by seller E is 5: 8, then find the difference between the number of black cups and white cups sold by seller E.(Assume only black and white cups are sold by seller E)
A.100
B.120
C.130
D.150
E.None of these
34) The number of plastic cups sold by seller A is approximately what percent of the total number of cups sold by seller C?
A.11%
B.22%
C.33%
D.44%
E.55%
35) Find the ratio of the total number of glass cups sold by sellers A, C and E together to the total number of plastic cups sold by B and D together.
A.1549: 590
B.133: 141
C.110: 191
D.252: 141
E.None of these
Directions (36-40): Study the following information carefully and answer the questions given below.
The given table shows the number of persons who visited four different theatres in five different days.
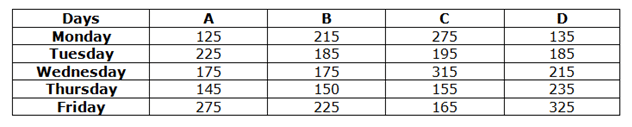
36) What is the ratio of the number of persons who visited on Monday to Thursday in all the theatres together?
A.10:9
B.15:14
C.6:5
D.9:8
E.None of these
37) What is the average number of persons who visited theatre D on all the days together?
A.220
B.218
C.216
D.219
E.213
38) The number of persons who visited in A on Saturday is 20% more than the number of persons who visited in A on Wednesday and the number of persons who visited in A on Sunday is 40% more than the number of persons who visited in A on Monday. What is the difference between the number of persons who visited in A on Saturday and Sunday?
A.35
B.30
C.40
D.45
E.50
39) If the ratio of the number of male to female visitors on Monday in B and C is 3:2 and 5:6 respectively, then the number of female visitors in C on Monday is what percent of the number of female visitors in B on Monday?
A.170.81%
B.174.41%
C.178.82%
D.180.25%
E.188.12%
40) What is the difference between the number of visitors on Tuesday and Friday in all the theaters together?
A.150
B.180
C.200
D.240
E.280
Try Data Interpretation Questions Online Mock Test
Answers :
31) Answer: C
Number of non-defective glass cups sold by seller C = 90/100 * 620 = 558
Number of non-defective plastic cups sold by seller C = 80/100 * (950 – 620) = 264
Number of non-defective cups sold by seller C = 558 + 264 = 822
32) Answer: C
Number of glass cups sold by seller B = 480
Red colour plastic cups sold by seller D = (100 – 80)/100 * 480 = 96
33) Answer: B
Total cups sold by E = 520
Number of black cups sold by E = 5/13 * 520 = 200
Number of white cups sold by seller E = 8/13 * 520 = 320
Required difference = 320 – 200 = 120
34) Answer: B
Number of plastic cups sold by seller A = 920 – 714 = 206
Total number of cups sold by seller C = 950
Required % = 206/950 * 100 = 22%
35) Answer: A
Number of glass cups sold by sellers A, C and E together = 714 + 620 + 215 = 1549
Number of plastic cups sold by B and D together = (840 – 480) + (720 – 490) = 590= 360 + 230
Required ratio = 1549: 590
36) Answer: E
Required ratio = (125 + 215 + 275 + 135):(145 + 150 + 155 + 235)
= 750:685
= 150:137
37) Answer: D
Required average = (135 + 185 + 215 + 235 + 325)/5
= 1095/5
= 219
38) Answer: A
Saturday in A = 120/100 * 175 = 210
Sunday in A = 140/100 * 125 = 175
Difference = 210 – 175
= 35
39) Answer: B
Required percentage = (6/11 * 275)/(2/5 * 215) * 100
= 150/86 * 100
= 174.41%
40) Answer: C
Required difference = (275 + 225 + 165 + 325) – (225 + 185 + 195 + 185)
= 990 – 790
= 200
Start Quiz
Directions (41-45): Study the following information carefully and answer the given questions:
The given table shows the five different school students like four different subjects.
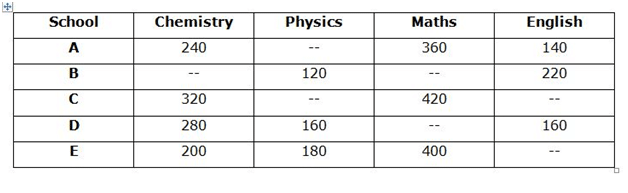
41) If the average number of students in school E is 225 and the number of students like English in E is 80% of the number students like chemistry in B. What is the average number of students like chemistry in all the schools together?
A.218
B.228
C.238
D.248
E.None of these
42) The number of students like physics in A is 2/3rd of the number of students like Maths in C. What is the total number of students in A?
A.1020
B.1030
C.1040
D.1010
E.None of these
43) What is the ratio of the number of students like English in A, B and D together to the number of students like Maths in A and E together?
A.11:17
B.2:3
C.13:19
D.7:10
E.None of these
44) The number of students like Maths in B is equal to the number of students like Chemistry in E and the number of the students like physics in C is 80% of the number of students like Maths in E. If the ratio of the number of students like physics in C to the number of students like Maths in D is 8:9, then what is the total number of students like Maths in all the schools together?
A.1280
B.1680
C.1530
D.1490
E.None of these
45) The number of students like Physics in D is approximately what percent of the number of students like 1English in B?
A.73%
B.75%
C.77%
D.79%
E.71%
Directions (46-50): Study the following information carefully and answer the given questions:
The given table shows the number of three different color balls in four different boxes.
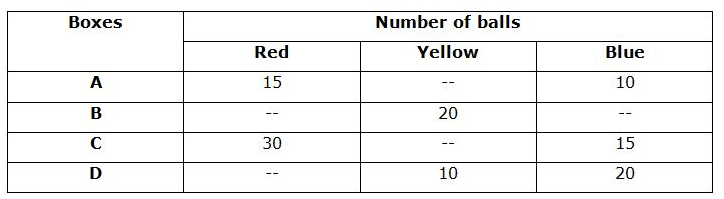
46) The average number of blue balls in all the boxes together is 15 and the number of blue balls in B is equal the number of red balls in box D. What is the average number of balls in D?
A.20
B.10
C.15
D.12
E.None of these
47) Ratio of the number of red balls in B and D is 2:1 and average number of balls in box B is 25. If the total number of red balls in all the boxes together is 75, what is the number of blue balls in box B?
A.30
B.35
C.20
D.25
E.15
48) Total number of balls in box D is 45 and the ratio of the number of red balls in D to the number of yellow balls in A is 3:4. What is the total number of balls in A?
A.40
B.30
C.35
D.45
E.None of these
49) Average number of balls in C is 21 and the average number of yellow balls in all the boxes together is 15. What is the ratio of the number of yellow balls in A to the number of blue balls in D?
A.2:3
B.3:5
C.4:7
D.1:3
E.5:8
50) Total number of balls in all the boxes together is 200. Ratio of the total number of balls in A, B, C and D is 9:9:13:9 and ratio of the red and blue balls in B is 2:3. What is the ratio of the number of yellow balls in A and C together to the number of red balls in B and D together?
A.4:3
B.5:3
C.8:5
D.7:3
E.None of these
Try Data Interpretation Questions Online Mock Test
Answers :
41) Answer: C
Total number of students in school E=225 * 4=900
Number of students like English in E=900 – (200 + 180 + 400)=120
Number of students like chemistry in B=100/80 * 120=150
Average of the number of students like chemistry in all the schools together=(240 + 320 + 280 + 200 + 150)/5
=238
42) Answer: A
Number of students like physics in A=2/3 * 420
=280
Total number of students in school A=240 + 280 + 360 + 140
=1020
43) Answer: C
Required ratio=(140 + 220 + 160):(360 + 400)
=520:760
=13:19
44) Answer: E
Number of students like Maths in B=200
Number of students like Physics in C=80/100 * 400=320
Number of students like Maths in D=9/8 * 320=360
Total number of students like Maths=360 + 200 + 420 + 360 + 400
=1740
45) Answer: A
Required percentage=160/220 * 100=73%
46) Answer: C
Total number of blue balls=15 * 4=60
Number of blue balls in B=60 – 10 – 15 – 20=15
Average number of balls in D=(10 + 20 + 15)/3=15
47) Answer: B
Red balls=75
Number of red balls in B and D=75 – 15 – 30=30
Number red balls in B=2/3 * 30=20
Total number of red balls in box B=25 * 3=75
Number of blue balls in B=75 – 20 – 20=35
48) Answer: D
Number of red balls in D=45 – 10 – 20=15
Number of yellow balls in A=4/3 * 15=20
Total number of balls in A=20 + 15 + 10=45
49) Answer: B
Total number balls in C=21 * 3=63
Yellow balls in C=63 – 30 – 15=18
Total number of yellow balls=15 * 4=60
Yellow balls in A=60 – 20 – 18 – 10=12
Number of blue balls in D=20
Required ratio=12:20=3:5
50) Answer: C
Total number of balls in A =9/40 * 200=45
Number of yellow balls in A=45 – 15 – 10=20
Total number of balls in C=13/40 * 200=65
Number of yellow balls in C=65 – 30 – 15=20
Total number balls in B=9/40 * 200=45
Number of red balls in B=2/5 * (45 – 20)=10
Total number of balls in D=9/40 * 200=45
Number of red balls in D=45 – 10 – 20=15
Required ratio=(20 + 20):(10 + 15)
=40:25
=8:5
Start Quiz
Directions (51-55): Study the following information carefully and answer the questions given below.
The below table shows the total number of students from three different departments in four different years in an engineering college and the percentage of number of boys among them
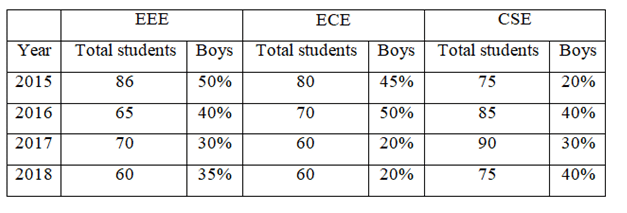
51) Find the average number of girl students in CSE department in the years 2015, 2017 and 2018.
A.50
B.52
C.54
D.56
E.None of these
52) Find the difference between the total number of students in ECE department in 2016 and the total number of boy students in EEE department in 2018.
A.40
B.47
C.49
D.54
E.58
53) What is the ratio of the number of girl students in EEE department in 2016 to the number of boy students in CSE department in 2017?
A.13: 9
B.12: 11
C.3: 4
D.7: 5
E.None of these
54) Find the difference between the number of boy students in ECE department in 2018 and the number of girl students in CSE department in 2015?
A.44
B.48
C.54
D.59
E.None of these
55) Number of EEE students in the year 2018 is approximately what percent of the number of CSE students in the year 2017?
A.52%
B.54%
C.67%
D.78%
E.98%
Directions (56-60): Study the following information carefully and answer the questions given below.
The following table shows the information about the number of students attended mock tests in English and Hindi from various states
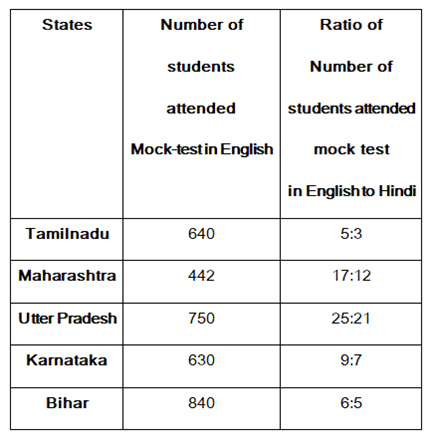
56) Find the sum of the number of students attended mock test in English from UP and Hindi from Karnataka?
A.1420
B.1402
C.1240
D.1204
E.1360
57) Find the average number of students attended mock test in Hindi from all the states together?
A.502.6
B.502.7
C.503.6
D.503.8
E.None of these
58) Number of students attended mock test in English from Karnataka is what percentage of Hindi from Bihar?
A.75%
B.80%
C.90%
D.66.67%
E.50%
59) Find the ratio of the number of students from Bihar & Uttar Pradesh attended mock test in English to number of students from Tamilnadu & Maharashtra attended mock test in Hindi?
A.265:116
B.256:117
C.265:118
D.116:265
E.256:116
60) In which state, number of students attended mock test in Hindi is maximum?
A.Uttar Pradesh
B.Maharashtra
C.Tamilnadu
D.Bihar
E.Karnataka
Try Data Interpretation Questions Online Mock Test
Answers :
51) Answer: D
Number of girl students in CSE department in 2015 = 80% of 75 = 60
Number of girl students in CSE department in 2017 = 70% of 90 = 63
Number of girl students in CSE department in 2018 = 60% of 75 = 45
Required average = (60 + 63 + 45)/3 = 168/3 = 56
52) Answer: C
Total number of students in ECE department in 2016 = 70
Total number of boys in EEE department in 2018 = 35% of 60 = 21
Required difference = 70 – 21 = 49
53) Answer: A
Number of girl students in EEE department in 2016 = 60% of 65 = 39
Number of boy students in CSE department in 2017 = 30% of 90 = 27
Required ratio = 39: 27 = 13: 9
54) Answer: B
Number of boy students in ECE department in 2018 = 20% of 60 = 12
Number of girl students in CSE department in 2015 = 80% of 75 = 60
Required difference = 60 – 12 = 48
55) Answer: C
Number of EEE students in the year 2018 = 60
Number of CSE students in the year 2017 = 90
Required % = 60/90 * 100 = 66.66% = 67%
Directions (56-60) :
Given table can be rewritten as,
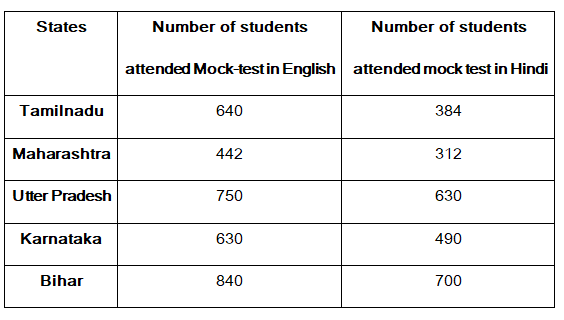
56) Answer: C
Required sum = 750+490 = 1240
57) Answer: E
Required average = 384+312+630+490+700/5 = 503.2
58) Answer: C
Required percentage = 630/700 x100 = 90%
59) Answer: A
Total number of students attended mock test in English from Bihar & Uttar Pradesh = 840+750 = 1590
Total number of students attended mock test in Hindi from tamilnadu& Maharashtra = 384+312 = 696
Required ratio =1590: 696=265: 116
60) Answer: D
From the table,
Number of students attended mock test in Hindi from Bihar is maximum among the given states.

Aptitude questions and answers for student to practice previous year exams, interview, competitive examination and entrance exams