


Data Interpretation Test Practice – Day 59 | Data Interpretation Questions:
Dear Readers, Important Practice Data Interpretation Questions for IBPS Exams 2017 was given here with Solutions. Aspirants those who are preparing for the Bank Examination and other Competitive Examination can use this material.
Click Here for More Practice Data Interpretation Questions
[WpProQuiz 771]
Click “Start Quiz” to attend these Questions and view Solutions
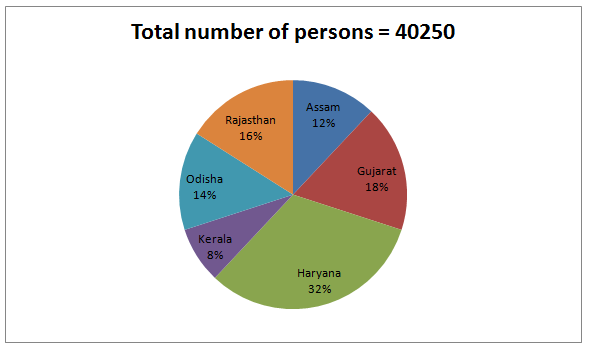
Directions (Q. 1-5): Study the following pie-chart and table carefully and answer the questions given below.
The pie-chart shows the percentage of persons in a country working in night shift in different states.
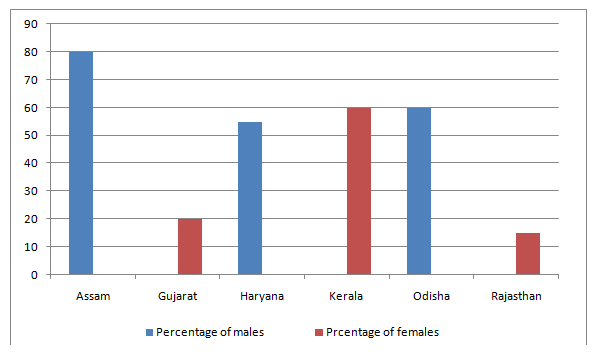
The bar graph shows the percentage of male and female workers in night shift in various states
Note: (In percentage distribution some data missing find them by calculating other data)
- What is the total number of men working in night shift in all the states together?
a) 28458
b) 26448
c) 27444
d) 26888
e) 26258
- What is the difference between men working in Rajasthan and Odisha together and women working in Assam and Kerala together?
a) 5907
b) 5767
c) 5957
d) 5417
e) None of these
- In which state is the total number of female workers the maximum?
a) Assam
b) Gujarat
c) Odisha
d) Kerala
e) Haryana
- What is the ratio of men to women working in night shift at Haryana?
a) 11 : 19
b) 9 : 11
c) 9 : 13
d) 11 : 9
e) None of these
- What is the approximate average number of females working in night shift in all the states together?
a) 2227
b) 2230
c) 2210
d) 2240
e) 2127
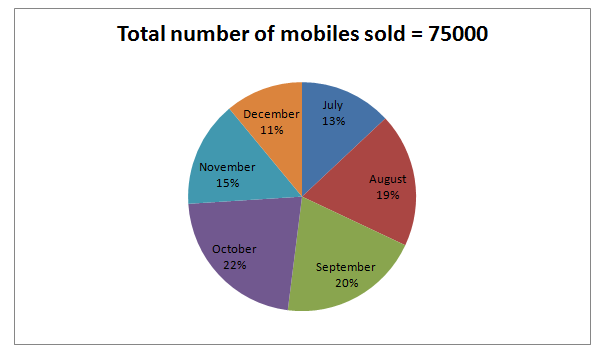
Directions (Q. 6-10): Study the following pie-chart and bar graph carefully and answer the questions given below.
Percentage distribution of the number of mobiles sold by a shop during six months
Total number of mobiles sold = 75000
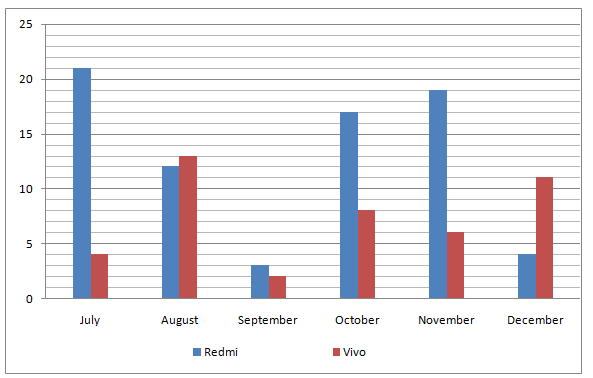
The ratio of the number of mobiles of Redmi to the number of mobiles of Vivo sold during six months
- If 37% of the mobiles of Vivo were sold at a discount in November, how many mobiles of Vivo were sold without any discount during the same month?
a) 1697
b) 1681
c) 1701
d) 1709
e) 1721
- What is the total number of mobiles of Vivo sold during November and December?
a) 7880
b) 9180
c) 8350
d) 9750
e) 8750
- The number of mobiles of Redmi sold during July is approximately what per cent of the number of mobiles of Redmi sold during November?
a) 93%
b) 100%
c) 88%
d) 96%
e) 90%
- What is the ratio of the number of mobiles of Vivo sold during July to that sold during October?
a) 13:44
b) 132:139
c) 75:132
d) 122:39
e) 132 : 39
- If the dealer earned a profit of 517 on each mobile of Vivo sold during October, what was his total profit earned on the mobile of that company during the same month?
a) 4756740
b) 2729760
c) 2595760
d) 3078790
e) 2098710
Click Here for More Practice Data Interpretation Questions

🙂
Sir explain ques 1 did not gettin
40250 – (2227 × 6)
5/10
ty ig:)
calculation ke sath time nai padta 13-15 mint lge mere to:( so slow
atleast 10 min dena chahiye calculative h 5 min me to 1 hi hua
yes yr. time kam milta h but koi nai speed he bad jayegi esse bhne:
first sum ka solution ka short cut plz explain mod@ibps guideplzzzz
2227*6 kaise ye to last question ka solution h