


Dear Aspirants, Our IBPS Guide team is providing new series of Quantitative Aptitude Questions for IBPS PO Prelims 2019 so the aspirants can practice it on a daily basis. These questions are framed by our skilled experts after understanding your needs thoroughly. Aspirants can practice these new series questions daily to familiarize with the exact exam pattern and make your preparation effective.
Check here for IBPS PO Prelims Mock Test 2019
Check here for IBPS PO Mock Test 2019
[WpProQuiz 6922]Directions (1 – 5): Study the following charts and answer the given questions.
The following bar graph shows the production of paper (in lakh tones) by three different companies A, B and Cover the years.
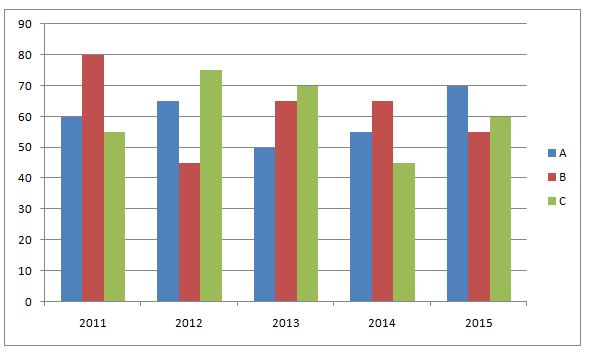
1) In which year the percentage of production of company B to the production of company A is maximum?
a) 2012
b) 2011
c) 2014
d) 2013
e) 2015
2) What is the difference between the production of company A in 2012 and company B in 2011?
a) 25 lakh tones
b) 31 lakh tones
c) 34 lakh tones
d) 35 lakh tones
e) 15 lakh tones
3) What is the ratio of the average production of company C in the period 2011-2014 to the average production of company A in the same period?
a) 45: 46
b) 47: 46
c) 49: 43
d) 43: 45
e) 49: 46
4) The average production for five years was Maximum for which company?
a) A
b) B
c) A and B
d) B and C
e) C
5) What is the approximate percentage increase in the production of company C from 2011 to 2013?
a) 31%
b) 22%
c) 27%
d) 36%
e) 24%
Directions (6 – 10): In each of these questions, a number series is given. In each series, only one number is missing. Find out the missing number.
6) 1, 16, 81, 256, 625, 1296, ?
a) 6829
b) 2467
c) 2401
d) 1780
e) 3870
7) 14, 17, 15, 18, 16, 19, ?
a) 17
b) 16
c) 27
d) 19
e) 8
8) 7380, 4428, 2656.8, 1594.08, 956.448, 573.87, ?
a) 215.62
b) 378.37
c) 344.32
d) 261.97
e) 245.346
9) 7, 13, 24, 40, 61, ?
a) 92
b) 87
c) 90
d) 83
e) 79
10) 1.6, 16, 192, 2688, ?, 774144
a) 57144
b) 43008
c) 14584
d) 52147
e) 71647
Answers:
Directions (1-5):
1) Answer: b)
In 2011= (80/60)*100=133.3%
In 2012= (45/65)*100=69.2%
In 2013= (65/50)*100=130%
In 2014= (65/55)*100=118.2%
In 2015= (55/70)*100=78.5%
2) Answer: e)
From the graph,
Required difference= 80 lakh tones- 65 lakh tones
= 15 lakh tones
3) Answer: e)
Total production in the given period of company A = 60 + 65 + 50 + 55
= 230
Required average production of company A = 230/4 = 57.5
Total production in the given period of company C = 55 + 75 + 70 + 45 = 245
Required average production of company C = 245/4 = 61.25
Required ratio = 61.25: 57.5
= 49: 46
4) Answer: b)
Average production of company A in the given period= (60+65+50+55+70)/5
= 60
Average production of company B in the given period= (80+45+65+65+55)/5
= 62
Average production of company C in the given period= (55+75+70+45+60)/5
= 61
Thus the company B has the maximum average
5) Answer: c)
Required percentage increase from 2011 to 2013 = [(70 – 55)/55] * 100
= 15/55 * 100
= 27%
Directions (6-10):
6) Answer: c)
The pattern of the series is 14, 24, 34, 44, 54……..
7) Answer: a)
The pattern of the series is +3,-2, +3, -2………..
8) Answer: c)
The pattern of the series is *3/5, *3/5, *3/5……………
9) Answer: b)
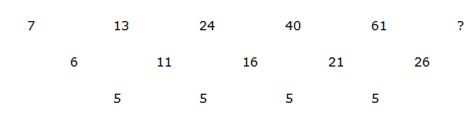
The difference of difference is 5.
10) Answer: b)
The pattern of the series is *10, *12, *14, *16……………


Leave a Reply