


Dear Aspirants, Our IBPS Guide team is providing new series of Quantitative Aptitude Questions for SBI Clerk Mains 2020 so the aspirants can practice it on a daily basis. These questions are framed by our skilled experts after understanding your needs thoroughly. Aspirants can practice these new series questions daily to familiarize with the exact exam pattern and make your preparation effective.
Data Interpretation
Direction (1-5): Study the following information carefully and answer the questions given below.
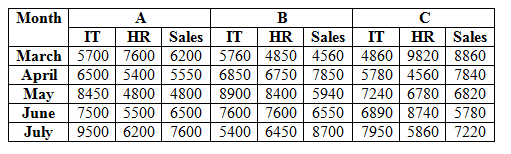
The given table shows the number of employee works in three different companies in five different months.
The given table shows the percentage of male employees in A in three different departments.
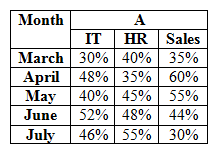
1) The number of female HR employees in C in March is 25% more than the number of female HR employees in A in March. Number of male HR employees in C in March is what percent of the number of male HR employees in A in March?
A) 130.45%
B) 135.52%
C) 145.71%
D) 140.25%
E) 149.25%
2) If the number of female IT employees in C in June is 10% more than the number of female IT employees in A in June and the number of female IT employees in C in July is 40% of the total number of IT employees in C in July. Find the percentage decrease in the number of female IT employees in C from June to July?
A) 19.69%
B) 20.45%
C) 21.56%
D) 18.72%
E) 15.93%
3) What is the total number of female Sales employees in A in all the months together?
A) 16360
B) 17470
C) 16370
D) 17370
E) 15370
4) Out of 60% of total number of HR employees in B in March are regular employees and out of 40% of the total number of sales employees in A in April are regular employees. What is the difference between the regular HR employees in B in March and the regular sales employees in A in April?
A) 580
B) 630
C) 690
D) 530
E) 490
5) Out of 40% of the total number of sales employees in B in July are female and out of 25% of the total number of sales employees in C in April are female. What is the ratio of number of female sales employees in B in July to the number of female sales employees in C in April?
A) 87:49
B) 89:45
C) 96:47
D) 81:43
E) None of these
Data Interpretation
Direction (6-10): Study the following information carefully and answer the questions given below.
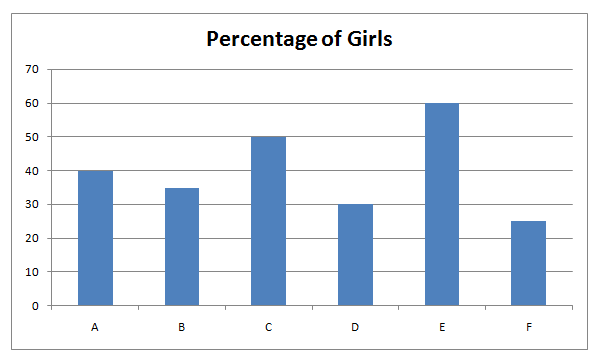
The given bar graph shows the percentage of girls in different colleges.
The given table shows the ratio of the boys and girls in CSE and ECE departments in different colleges.
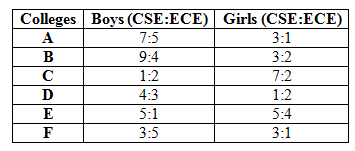
6) If the total number ECE boys in D is 14 more than the total number of ECE boys in B and the total number of CSE girls in B is 24 more than the total number of CSE girls in D, then what is the average number of total number of students in B and D together?
A) 170
B) 180
C) 190
D) 200
E) None of these
7) If the total number of ECE boys in D is 18 more than the total number of ECE girls in D, then what is the difference between the total number of CSE boys in D and the total number of ECE girls in D?
A) 18
B) 24
C) 28
D) 36
E) None of these
8) If total number of CSE boys in A is 140 and the total number of students in B is 25% more than the total number of students in A, then the total number of ECE girls in B is what percent of the total number of CSE girls in B?
A) 33.33%
B) 44.44%
C) 55.55%
D) 66.66%
E) 77.77%
9) If the total number of CSE students in C is equal to the total number of CSE students in F, then what is the ratio of the total number of students in C to F?
A) 27:32
B) 25:31
C) 24:35
D) 28:33
E) None of these
10) If the average number of ECE students in C is 12 which is 60% of the total number of ECE boys in B, then total number of students in C is what percent of the total number of students in B?
A) 50%
B) 52%
C) 54%
D) 56%
E) 58%
Answers :
Directions (1-5) :
1) Answer: B
Number of female HR employees in A in March = 60/100 * 7600 = 4560
Number of male HR employees in A in March = 40/100 * 7600 = 3040
Number of female HR employees in C in March = 125/100 * 4560 = 5700
Number of male HR employees in C in March = 9820 – 5700 = 4120
Required percentage = 4120/3040 * 100 = 135.52%
2) Answer: A
Number of female IT employees in A in June = 7500 * 48/100 = 3600
Number of female IT employees in C in June = 3600 * 110/100 = 3960
Total number of IT employees in C in July = 7950
Number of female IT in C in July = 40/100 * 7950 = 3180
Required percentage = (3960 – 3180)/3960 * 100 = 19.69%
3) Answer: D
Number of female sales employees in A in march = 65/100 * 6200 = 4030
Number of female sales employees in A in April = 40/100 * 5550 = 2220
Number of female sales employees in A in May = 45/100 * 4800 = 2160
Number of female sales employees in A in June = 56/100 * 6500 = 3640
Number of female sales employees in A in July = 70/100 * 7600 = 5320
Required total = 4030 + 2220 + 2160 + 3640 + 5320 = 17370
4) Answer: C
Total number of HR employees in B in March = 4850
Regular HR employees in B in March = 60/100 * 4850 = 2910
Total number of sales employees in A in April = 5550
Regular sales employees in A in April = 40/100 * 5550 = 2220
Required difference = 2910 – 2220 = 690
5) Answer: A
Total number of sales employees in B in July = 8700
Number of female sales employees in B in July = 40/100 * 8700 = 3480
Total number of sales employees in C in April = 7840
Number of female sales employees in C in April = 25/100 * 7840 = 1960
Required ratio = 3480:1960
= 87:49
Directions (6-10) :
6) Answer: C
Total number of ECE boys in D = 3/7 * 70/100 * D = 0.3D
Total number of ECE boys in B = 4/13 * 65/100 * B = 0.2B
Total number of CSE girls in B = 3/5 * 35/100 * B = 0.21B
Total number of CSE girls in D = 1/3 * 30/100 * D = 0.1D
0.3D – 0.2B = 14
0.21B – 0.1D = 24
D = 180
B = 200
Required average = (180 + 200)/2 = 190
7) Answer: D
Total number of students in D = x
Boys = 70/100 * x = 0.7x
Girls = 30/100 * x = 0.3x
Number of CSE boys in D = 0.7x * 4/7 = 0.4x
Number of ECE boys in D = 0.7x * 3/7 = 0.3x
Number of CSE girls in D = 0.3x * 1/3 = 0.1x
Number of ECE girls in D = 0.3x * 2/3 = 0.2x
0.3x – 0.2x = 18
x = 180
Difference = 0.4 * 180 – 0.2 * 180
= 36
8) Answer: D
Total number of students in A = x
Total number of CSE boys in A = 7/12 * 60/100 * x = 0.35x
0.35x = 140
x = 400
Total number of students in B = 400 * 125/100 = 500
Total number of CSE girls in B = 3/5 * 35/100 * 500 = 105
Total number of ECE girls in B = 2/5 * 35/100 * 500 = 70
Required percentage = 70/105 * 100 = 66.67%
9) Answer: A
Total number of students in C = x
Total number of students in F = y
Total number of CSE students in C = (1/3 * 50/100 * x) + (7/9 * 50/100 * x)
= 5x/9
Total number of CSE students in F = (3/8 * 75/100 * y) + (3/4 * 25/100 * y)
= 15y/32
5x/9 = 15y/32
x/y = 27/32 = 27: 32
| Check Here to View SBI Clerk Mains 2020 Quantitative Aptitude Questions | ||
| Day 54 | Day 53 | Day 52 |
| Click Here for SBI Clerk 2020 – Detailed Exam Notification | ||


Leave a Reply