


SBI PO 2019 Notification will be expected soon. It is one of the most expected recruitment among the banking aspirants. Every year the exam pattern for SBI PO has been changing. Depends upon the changing of exam pattern the questions are quite harder compare to the previous year. So the questions are in high level than the candidate’s assumption.
As per the latest trend, our IBPS Guide is providing the updated New Exam Pattern Quantitative Aptitude questions for SBI PO 2019 Day 10. Our Skilled experts were mounting the questions based on the aspirant’s needs. So candidates shall start your preparation and practice on daily basis with our SBI PO pattern quantitative aptitude questions 2019 day 10. Start your effective preparation from the right beginning to get success in upcoming SBI PO 2019.
“Be not afraid of growing slowly; be afraid only of standing still”
[WpProQuiz 5122]
Click Here for SBI PO Pre 2019 High-Quality Mocks Exactly on SBI Standard
Click Here to View Quantitative Aptitude Questions in Hindi
Directions (Q. 1 – 5): What value should come in place of (?) in the following number series?
1) 312, 156, 104, 78, 62.4, ?
a) 52
b) 48
c) 33
d) 36
e) 44
2) 114, 231, 689, 2761, ?
a) 9236
b) 8372
c) 10458
d) 13799
e) 8567
3) 752, 752, 758, ? , 820, 892
a) 790
b) 778
c) 806
d) 766
e) 784
4) 23, 73, ? , 1257, 6501, 39349
a) 312
b) 359
c) 283
d) 556
e) 647
5) 552, 580, 612, ? , 736, 924
a) 656
b) 644
c) 682
d) 708
e) 716
Directions (Q. 6 – 10): Study the following information carefully and answer the given questions:
The following bar graph shows the total number of students playing different sports from various schools.
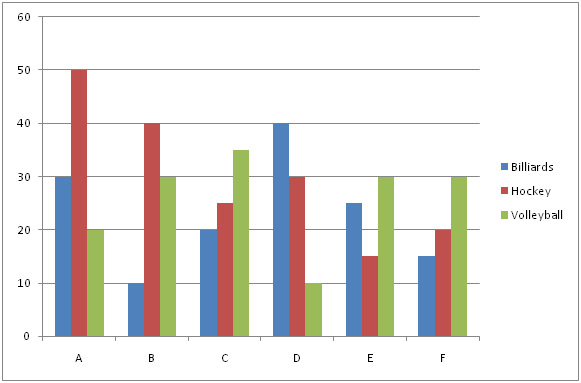
6) If the ratio between the total number of boys to that of girls playing Hockey from school A and B is 7 : 3 and 5 : 3 respectively, then find the difference between the average number of boys to that of girls playing Hockey from both the schools A and B together?
a) 50
b) 40
c) 30
d) 20
e) None of these
7) Find the average number of students playing Hockey from all the given schools together?
a) 30
b) 40
c) 55
d) 25
e) None of these
8) Total number of students playing all the given sports together from school C is approximately what percentage of total number of students playing all the given sports together from school F?
a) 88 %
b) 74 %
c) 105 %
d) 123 %
e) 112 %
9) Find the ratio between the total number of students didn’t play any sports from school A to that of total number of students from school D, if the total number of students playing all the given sports together from school A is 25 % of total number of students from school A and the percentage of students didn’t play any sports from school D is 80 %?
a) 2: 3
b) 1: 1
c) 5: 4
d) 3: 5
e) None of these
10) Find the difference between the total number of students playing Billiards to that of Volleyball from all the given schools together?
a) 30
b) 25
c) 15
d) 35
e) None of these
Answers :
Direction : (1-5) :
1) Answer: a)
The pattern is, *1/2, *2/3, *3/4, *4/5, *5/6,..
The answer is, 52
2) Answer: d)
The pattern is, *2 + 3, *3 – 4, *4 + 5, *5 – 6,…
The answer is, 13799
3) Answer: b)
The pattern is, + (12 – 1), + (32 – 3), + (52 – 5), + (72 – 7), + (92 – 9),…
The answer is, 778
4) Answer: c)
The pattern is, *2 + 33, *3 + 43, *4 + 53, *5 + 63, *6 + 73,….
The answer is, 283
5) Answer: a)
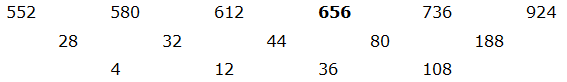
The difference of difference is, *3
The answer is, 656
Direction (6-10) :
6) Answer: c)
The average number of boys playing Hockey from both the schools A and B together
= > 50*(7/10) + 40*(5/8)
= > 35 + 25 = 60
The average number of girls playing Hockey from both the schools A and B together
= > 50*(3/10) + 40*(3/8)
= > 15 + 15 = 30
Required difference = 60 – 30 = 30
7) Answer: a)
The total number of students playing Hockey from all the given schools together
= > 50 + 40 + 25 + 30 + 15 + 20 = 180
Required average = 180/6 = 30
8) Answer: d)
Total number of students playing all the given sports together from school C
= > 20 + 25 + 35 = 80
Total number of students playing all the given sports together from school F
= > 15 + 20 + 30 = 65
Required % = (80/65)*100 = 123 %
9) Answer: b)
The total number of students didn’t play any sports from school A
= > (30 + 50 + 20)*(100/25)
= > 100*(100/25) = 400
Total number of students from school D
= > (40 + 30 + 10)*(100/20)
= > 80*5 = 400
Required ratio = 400: 400 = 1: 1
10) Answer: c)
The total number of students playing Billiards from all the given schools together
= > 30 + 10 + 20 + 40 + 25 + 15 = 140
The total number of students playing Volleyball from all the given schools together
= > 20 + 30 + 35 + 10 + 30 + 30 = 155
Required difference = 155 – 140 = 15

Leave a Reply